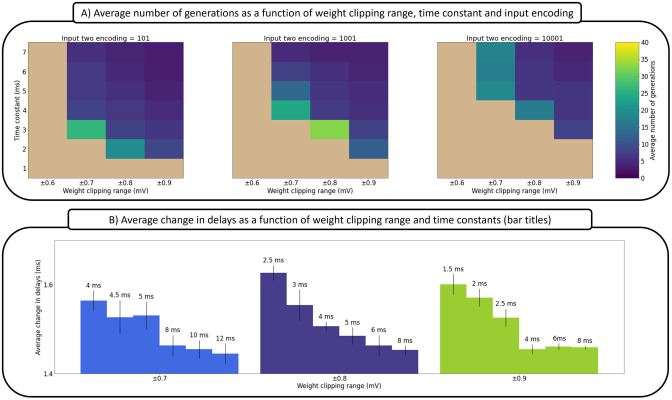
Fig 4. The relationship between time constants, input encoding and weight clipping range in weights-delays mutated solutions for the XOR problem.
(A) This interplay is captured through the average number of generations needed to reach a zero loss (perfect) solution, where each grid cell is the average of five solutions. (B) Average change in delays as a function of the weight clipping range and time constants. Each bar is the average of several populations of solutions that solve the XOR, XNOR, OR, and AND logic problems. For more details, see Tables E and F in S1 Text and the related text.

