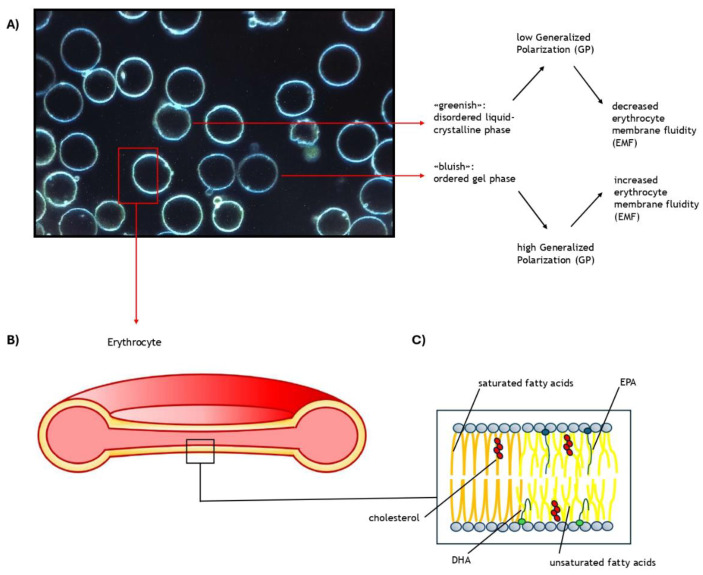
Figure 1.
This figure is a comprehensive illustration of the latest evidence on erythrocyte membrane fluidity: (A) This image was obtained through confocal microscopy after staining a blood sample with a specific probe (Laurdan). This probe is characterized by a shift in the emission spectrum reflecting the lipid phase state of the environment (bluish in ordered gel phases and greenish in disordered liquid–crystalline phases). After staining, five images of Laurdan emission intensity were acquired concurrently in two distinct channels (emission filter: 450/50 nm for the blue channel, 525/50 nm for the green channel) using a 60× immersion-oil objective. Generalized polarization (GP) was calculated as follows: GP = Iblue − G Igreen/Iblue + G Igreen, where Iblue and Igreen are the intensities for the blue and green channels, respectively, and G is a calibration factor that depends on the experimental setup. GP is a measure of membrane fluidity. (B) Longitudinal section of an erythrocyte. (C) Description of the main components of the erythrocyte membrane.

