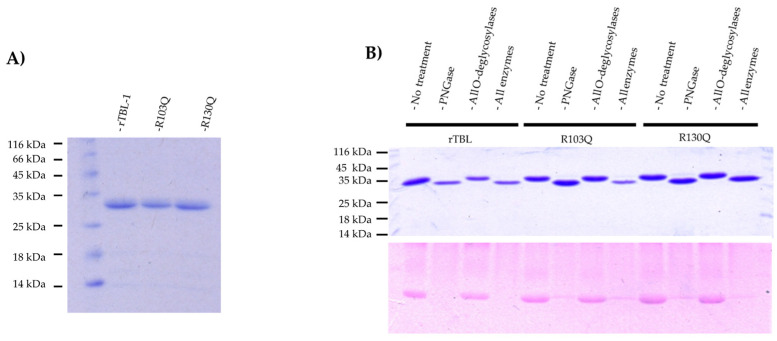
Figure 2.
Characterization of the mutants. (A) Molecular size comparison between rTBL-1 and the mutants. SDS-PAGE of the electrophoretic profiles of rTBL-1, R103Q, and R130Q. Lane 1, ladder; lane 2, 5 µg of rTBL; lane 3, 5 µg of R103Q; lane 4, 5 µg of R130Q. (B) Analysis of glycosylation. Top panel shows a coomassie R-250-stained SDS-PAGE. N-Glycosidase F (PGNaseF), all O-glycosidases (β1,4-Galactosidase, endo-α-N-acetylgalactosaminidase, α2-3,6,8,9-Neuraminidase, and β-N-Acetylglucosaminidase), all N- and O-glycosidases (N-Glycosidase F, β1,4-Galactosidase, endo-α-N-acetylgalactosaminidase, α2-3,6,8,9-Neuraminidase, and β-N-Acetylglucosaminidase).

