Table 1.
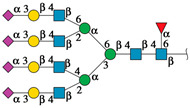
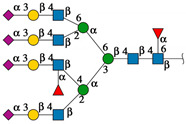
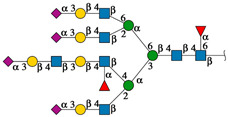
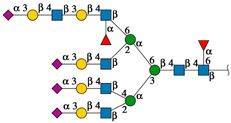
Comparison of the solvation free energy gain upon formation of the interface (ΔiG) of the complex EGFR-related N-glycans with the rTBL-1 and mutated Tepary bean lectins (R104Q, and R131Q).
| 2D-Graphical N-glycan Structure According to (SNFG) [28] | N-glycan ID [30] | Reported Molecular Mass (kDa) [30] | ΔiG (Kcal/mol) | ||
|---|---|---|---|---|---|
| rTBL-1 | R104Q | R131Q | |||

|
876 | 4.05 |

|

|

|
| −12.79 | −6.57 | −8.03 | |||
|
1944 | 3.68 |

|

|

|
| −7.99 | −6.44 | −8.20 | |||
|
1658 | 3.83 |

|

|

|
| −10.39 | −13.80 | −15.09 | |||
|
2132 | 4.19 |

|

|

|
| −10.99 | −3.18 | −11.75 | |||
|
2608 | 4.19 |

|

|

|
| −7.86 | −7.50 | −10.99 | |||
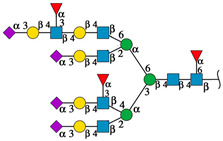
|
3414 | 4.34 |

|

|

|
| −12.59 | −8.91 | −5.83 | |||

| |||||
rTBL-1, Recombinant lectin; R104Q, Recombinant R104Q mutant lectin; R131Q, Recombinant R131Q mutant lectin.
