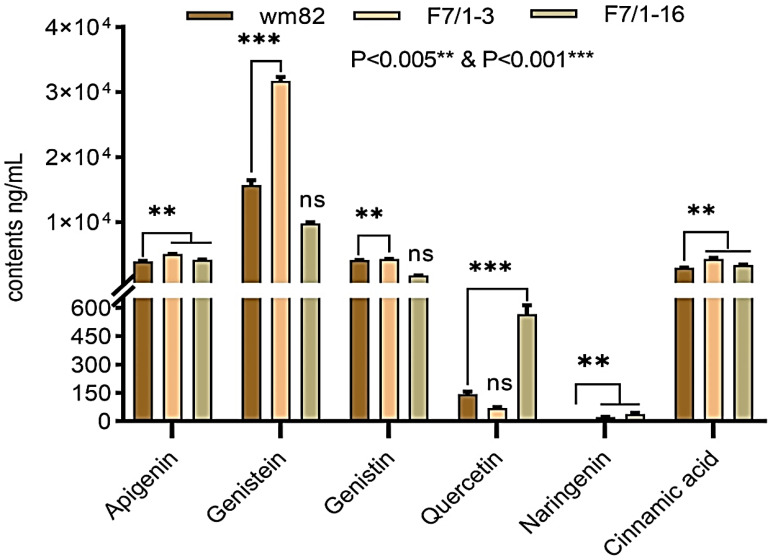
Figure 3.
The quantification of flavonoids and cinnamic acid through UPLC-QqQ-MS/MS in two soybean progenies (F7/1-3 and F7/1-16), their susceptible parental line Wm82. Different flavonoid accumulation and cinnamic acid concentrations were assessed by comparing them with their standard solutions of known concentration. Statistical differences among all the data were analyzed through one-way ANOVA (Bartlett’s Test) at the 0.05 level of significance. However, the significance of individual compounds was analyzed through Multiple T-test statistics. Each line shows significance in high flavonoid accumulation at p < 0.01 ** and p < 0.001 ***. ns = non-significant.

