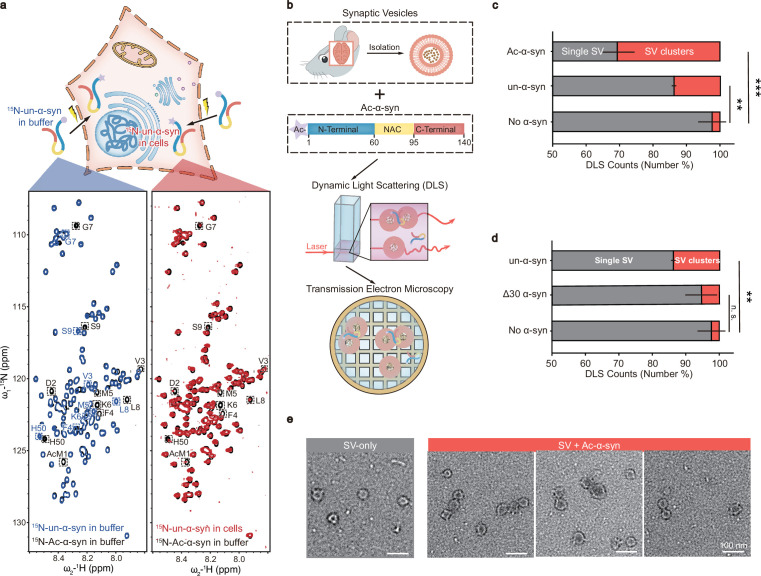
Figure 1. N-terminal acetylation enhances synaptic vesicle (SV) clustering induced by α-synuclein (α-syn).
(a) α-syn is N-terminally acetylated in cells. Upper panel: Schematic representation of the delivery of 15N-labeled N-terminally unmodified α-syn (un-α-syn) into mammalian cells through electroporation. Lower panel: Comparisons of 2D 1H-15N HSQC spectra of N-acetylated α-syn (Ac-α-syn) (black) with in-buffer un-α-syn (blue) and in-cell un-α-syn (red). Distinct assignments for nuclear magnetic resonance (NMR) cross-peaks corresponding to amino acids in Ac-α-syn and un-α-syn are enclosed and labeled. (b) Scheme of experimental design for the functional study of Ac-α-syn on SV clustering. SVs isolated from mouse brains were added to Ac-α-syn (Upper) for measuring size distribution by dynamic light scattering (DLS) (middle panel), and the sample was further visualized by using negatively stained transmission electron microscopy (TEM) (lower panel). (c) The influences of N-acetylation of α-syn and (d) α-syn without the N-terminal thirty residues on SV clustering measured by DLS. The X-axis represents the number percent of the single SV and clustered SVs counted by DLS. Error bars are standard deviations from three biological replicates. **p-value <0.01; ***p-value <0.001; analysis by Student’s t-test. (e) Representative negatively stained TEM images of the single SV and clustered SVs in SV samples with no α-syn (gray) and Ac-α-syn (red), respectively. Figure 1—source data 1 (c&d): the DLS numerical data of SV&Ac-α-syn, SV&un-α-syn, SV&Δ30-α-Syn, and SV-only (three biological replicates of each sample).

