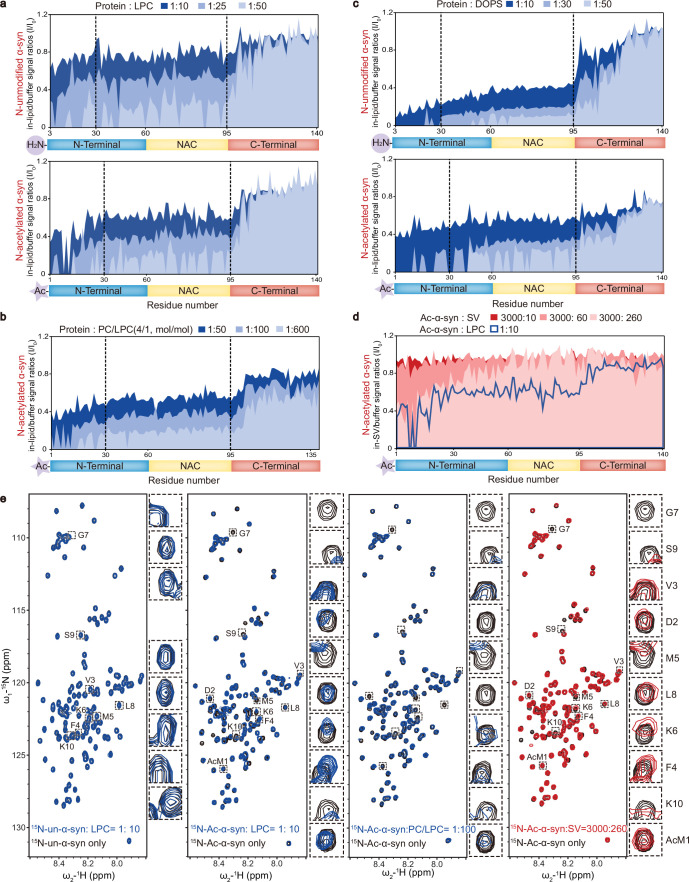
Figure 3. N-terminal acetylation increases the α-synuclein (α-syn)–lysophosphatidylcholine (LPC) interaction.
Comparisons of residue-resolved nuclear magnetic resonance (NMR) signal intensity ratios (I/I0) of un-α-syn (upper) and Ac-α-syn (lower) during titration with LPC micelles (a), LPC-containing liposomes (DOPC:LPC = 4:1, mol:mol) (b), and dioleoyl-phosphoserine (DOPS) liposomes (c) at indicated protein/lipid molar ratios. Dashed lines highlight the residue positions 30 and 95. (d) SVs isolated from mouse brains were employed for NMR titration with 15N-Ac-α-syn, approximating the physiological ratio (α-syn:SV = 4000:300, mol:mol). Residue-resolved NMR signal intensity ratios (I/I0) of Ac-α-syn is titrated by synaptic vesicles (SVs) to that in solution. The molar ratios of SV to Ac-α-syn are indicated. LPC titration in the Ac-α-syn/LPC ratio of 1:10 (blue curve) is overlaid on the SV titration. (e) 2D 1H-15N HSQC spectra of NMR for un-α-syn with LPC micelles and Ac-α-syn with LPC micelles, LPC-containing liposomes, and mouse SVs. The NMR cross-peaks of the first 10 residues are highlighted and magnified, as depicted on the right side of each spectrum set (Note: the first and second residues of un-α-syn cannot be assigned). Figure 3—source data 1 (a–d): the NMR titration numerical data of α-syn&LPC, Ac-α-syn&LPC, Ac-α-syn&4PC/LPC, α-syn&DOPS, Ac-α-syn&DOPS, and Ac-α-syn&SV.

