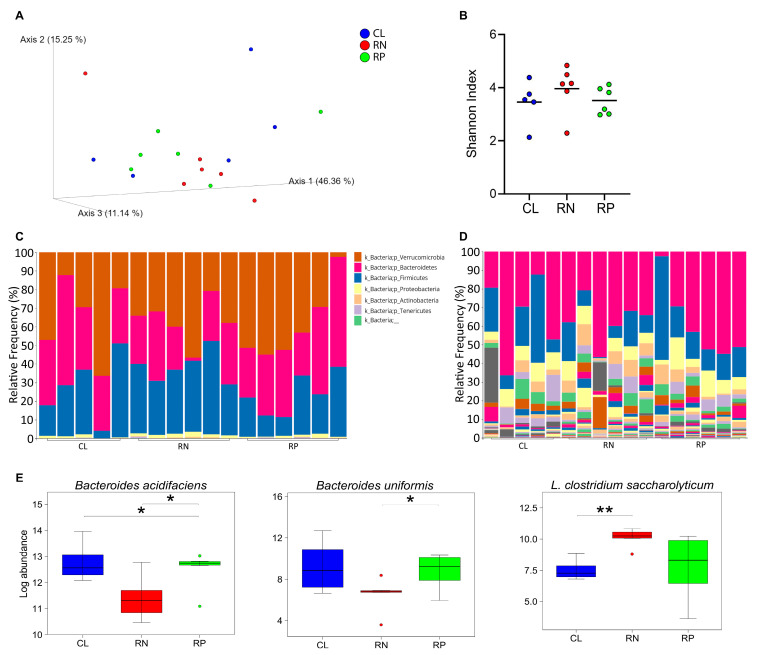
Figure 5.
Reducing amino acid content of diet induces a modest shift in bacterial populations. 16S rRNA profiling of bacteria was carried out on feces from mice fed control (CL), reduced protein (RP) or reduced NEAA (RN) diets for two weeks. (A) Data are shown as principal coordinate analysis. (B) Diversity of bacteria type, as determined by Shannon Index, is shown for each group. Black line indicates average value for each group. (C,D) Relative abundance of bacteria in each group is shown at the phyla (C) and species levels (D). (E) Those species that were higher than 1% of overall abundance in any one group and significantly different in at least one group are shown as log abundance. * p < 0.05; ** p < 0.01.

