. 2024 Dec 27;13:RP96536. doi: 10.7554/eLife.96536

Figure 2. Regulatory network of mitochondrial biogenesis.

(A) The transcriptional regulatory network of nuclear-encoded mitochondrial genes. (B) Bar graphs illustrating the promoter binding profiles of 49 synergistic enhancer transcription factors (TFs) within different groups of genes (nuclear-encoded mitochondrial genes, Mito-EBR genes, 49 synergistic enhancer TFs, and electron transport chain [ETC] genes). The number of genes in each group (orange) and the number of these bound by CG1603 (cyan) were highlighted.

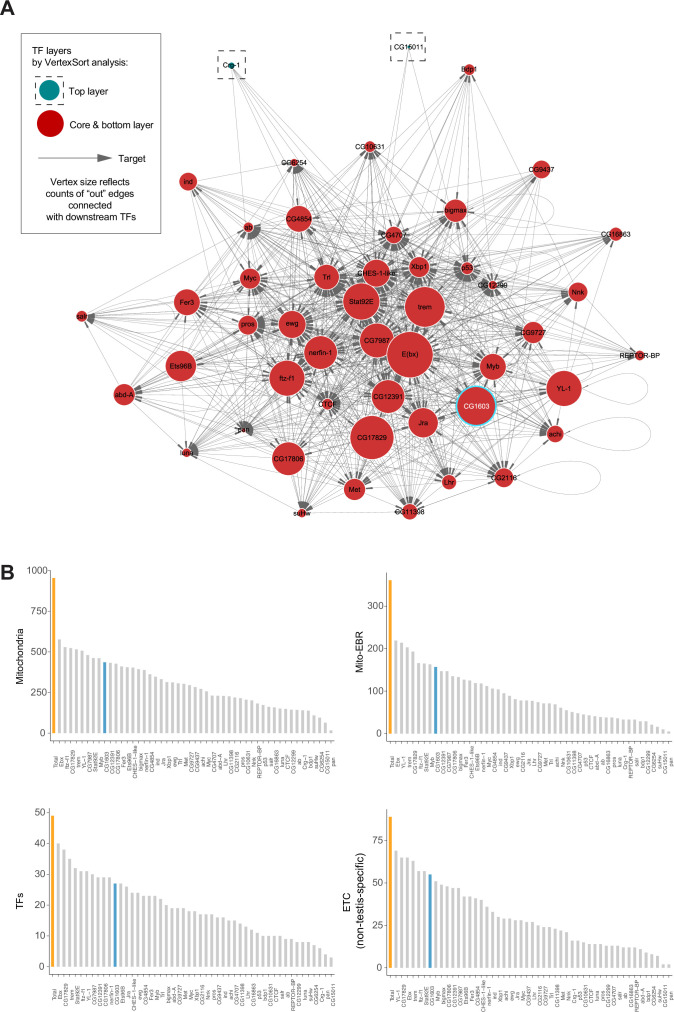
Figure 2—source data 1. Raw data used to generate Figure 2B.

Figure 2.

Figure 2—figure supplement 1. The promoter binding profiles of the enhancer transcription factors (TFs) in different mitochondrial biogenesis-related groups.

Figure 2—figure supplement 1.

Bar graphs summarizing the promoter binding profiles of the 49 synergistic enhancer TFs within subgroups of genes involved in different processes of electron transport chain (ETC) biogenesis. The number of genes in each subgroup (orange) and the number of these bound by CG1603 (cyan) were highlighted.
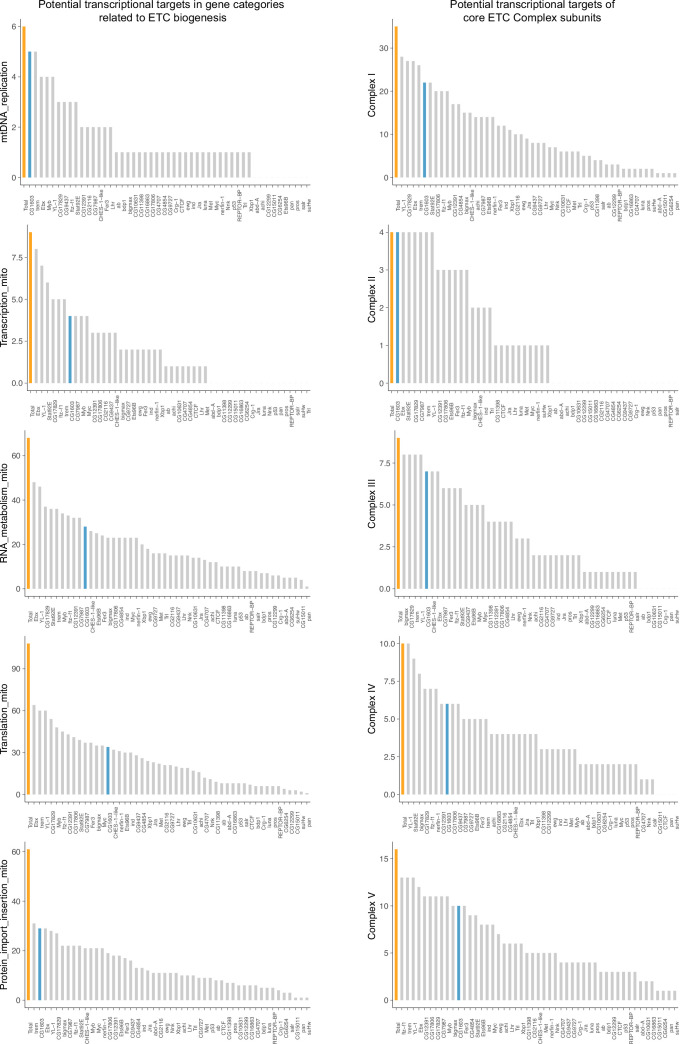
Figure 2—figure supplement 1—source data 1. Raw data used to generate Figure 2—figure supplement 1.