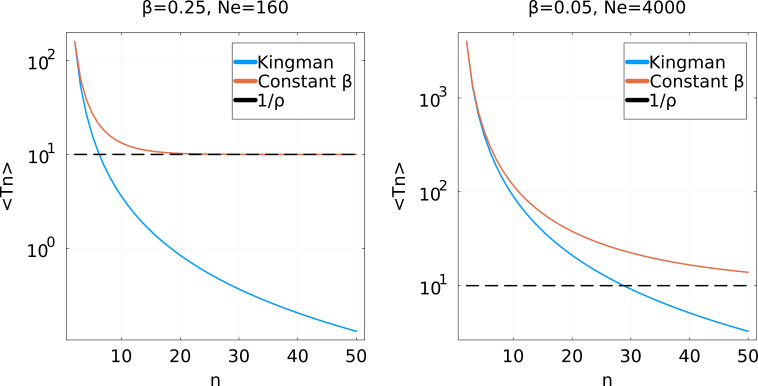
Appendix 2—figure 2. Average coalescence times for a partial sweep coalescent with effective population size and a Kingman coalescent with population size .
For simplicity, a constant is used: Left: a high value ; Right: a low value . For low , the two coalescent processes are very similar until a high . They considerably differ if is larger. Note that for the partial sweep process, never goes below .

