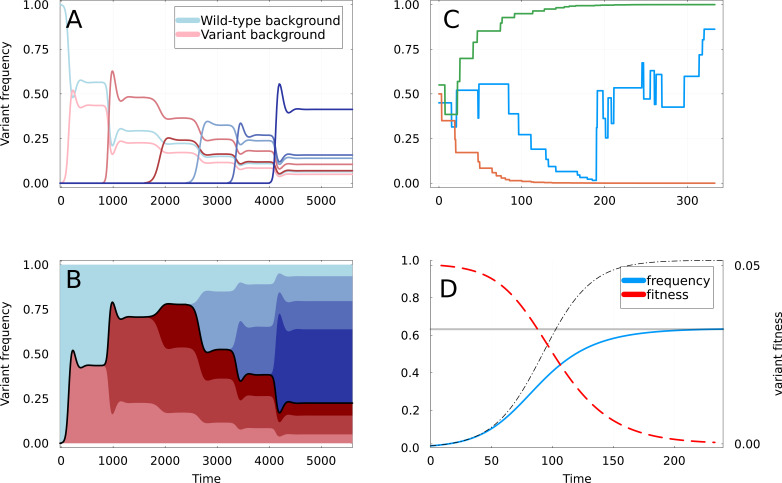
Figure 2. Dynamics of partial sweeps and subsequentfixation.
(A) Simulation of Susceptible-Infected-Recovered (SIR) Equation 1 & Equation 2 with additional strains appearing at regular time intervals. The fraction of infections (frequency) caused by each strain is shown as a function of time. The first strain to appear at is the variant of interest, and curves are shown in shades of red if they appear on the background of this variant, and of blue if they appear on the background of the wild-type. (B) Same as A but with frequencies stacked vertically. The black line delimiting the red and blue areas represents the frequency at which the mutations defining the original variant are found. (C) Three realizations of the random walk of Equation 9, all starting at . Two instances converge rapidly to frequencies 0 and 1, corresponding to apparent selective sweeps, while the remaining one oscillates for a longer time. (D) Representation of a partial sweep using the expiring fitness parametrization of Equation 11. The frequency of the variant is shown as a blue line saturating at value (gray line). The thin dashed line shows a selective sweep with constant fitness advantage . The fitness is a red dashed line, using the right-axis.

