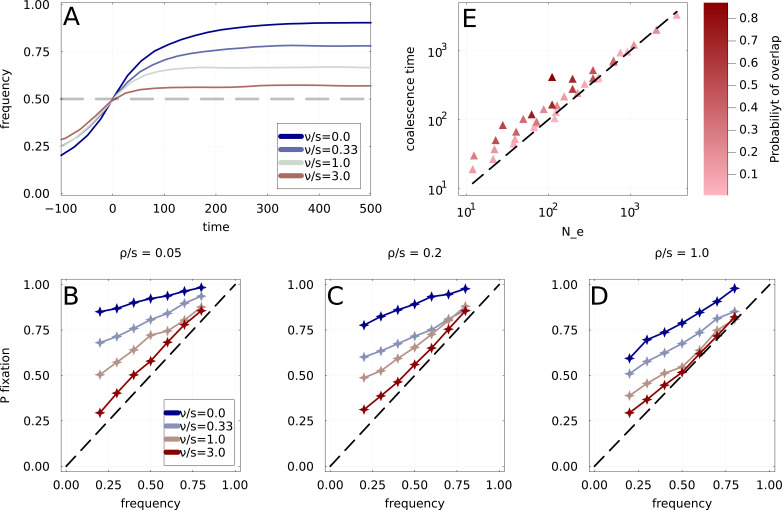
Figure 4. Simulations under the Wright-Fisher model with expiring fitness.
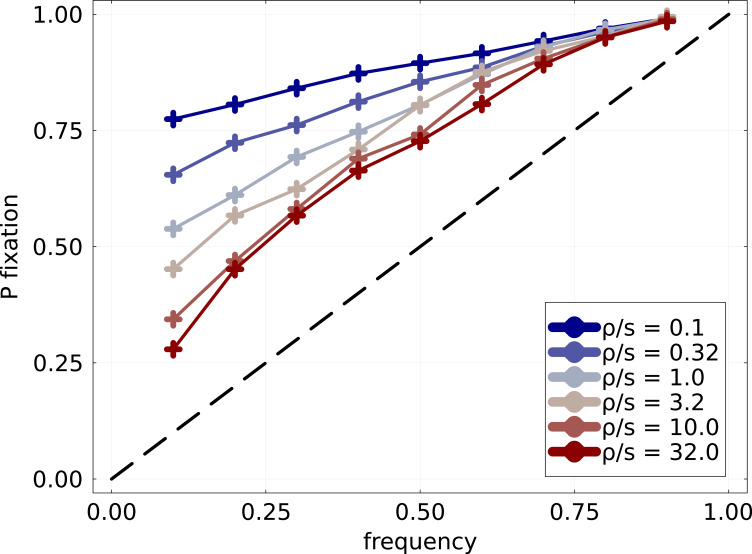
(A) Average frequency dynamics of immune escape mutations that are found to cross the frequency threshold , for four different rates of fitness decay. If the growth advantage is lost rapidly (high ), the trajectories crossing have little inertia, while stable growth advantage (small ) leads to steadily increasing frequencies. (B, C, D) Ultimate probability of of trajectories found crossing frequency threshold . Each panel corresponds to a different rate of emergence of immune escape variants, with four rates of fitness decay per panel. Increased clonal interference and fitness decay both result in a gradual loss of predictability. We use . (E) Time to most recent common ancestor for the simulated population, as a function of the prediction obtained using the random walk . Points correspond to different choices of parameters and , and a darker color indicates a higher probability of overlap as computed in Appendix 2.2.


