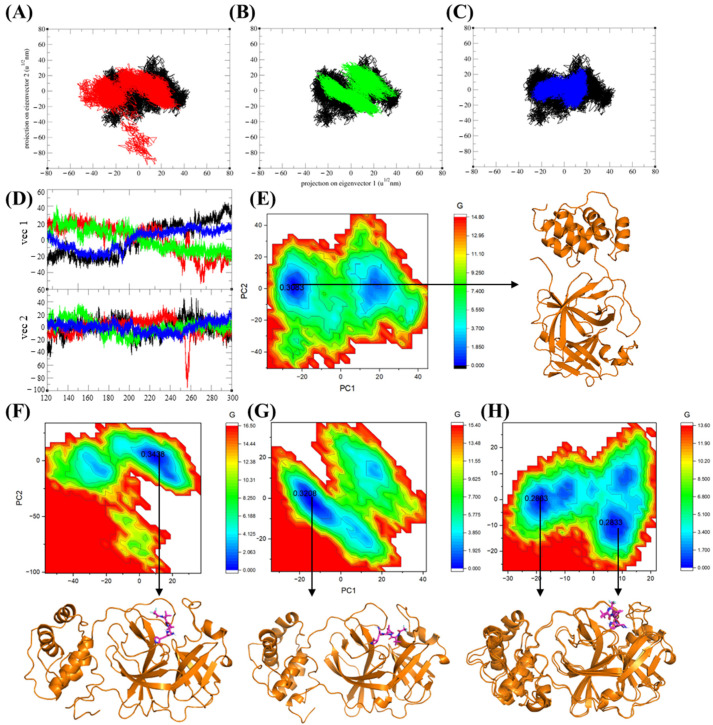
Figure 8.
Principal component analysis (PCA) trajectory projections of 3CLpro along eigenvector 1 (PC1) and eigenvector 2 (PC2), comparing the Nirmatrelvir-unbound form and Nirmatrelvir-bound complexes. Trajectory projections for (A) replicate 1, (B) replicate 2, and (C) replicate 3. (D) Eigenvector analysis of the 3CLpro in its Nirmatrelvir-unbound form and Nirmatrelvir-bound complexes. The black color represents the Nirmatrelvir-unbound 3CL protease, while red, green, and blue correspond to the complexed 3CL protease in replicates 1, 2, and 3, respectively. (E) Gibbs free energy (GFE) landscape and the representative structure with the lowest free energy of the Nirmatrelvir-unbound 3CL protease, and (F–H) GFE landscapes and the representative structures with the lowest free energy of the 3CL protease in the Nirmatrelvir-3CL protease complex for replicates 1, 2, and 3. The numbers 0.3083, 0.3438, 0.3208, and 0.2833 represent the free energy values (in kcal/mol) of the minima energy basins, indicating the most stable conformational states within the energy landscape.

