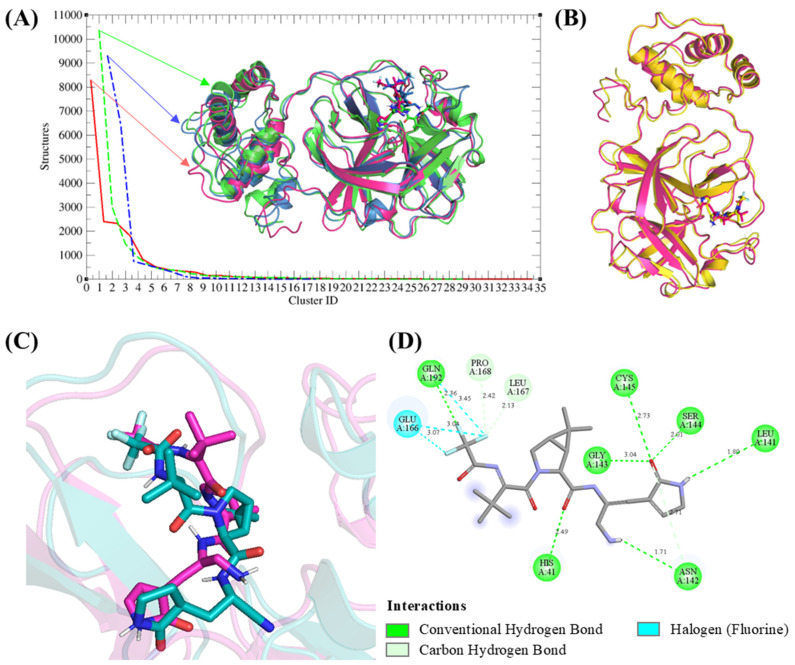
Figure 9.
Clustering and binding analysis of the Nirmatrelvir-3CL protease complex. (A) Cluster analysis identified 35, 29, and 17 clusters for replicas 1, 2, and 3, respectively. (B) Superimposition of the representative structure of replica 1 (magenta) with its lowest-energy structure (yellow), showing close alignment. (C) Superimposition of Nirmatrelvir in replica 1’s representative structure (magenta) with its docked pose (teal), revealing minimal deviations. (D) 2D interaction analysis of Nirmatrelvir with 3CL protease based on the representative structure of replica 1.

