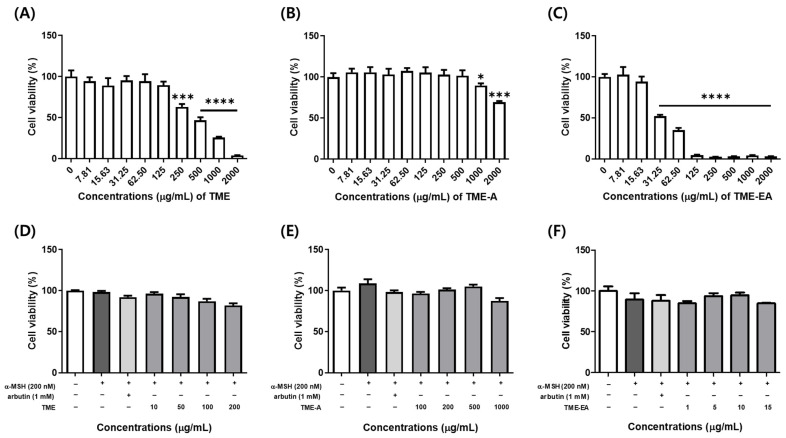
Figure 1.
Cytotoxicity of B16F10 cells following treatment with TME, TME-A, and TME-EA. The cells were treated with TME (A), TME-A (B), and TME-EA (C) for 24 h without α-MSH or with 10, 50, 100, and 200 µg/mL of TME (D), 100, 250, 500, and 1000 µg/mL of TME-A (E), and 1, 5, 10, and 15 µg/mL of TME-EA (F) with 200 nM α-MSH for 72 h. Arbutin (1 mM) was used as a positive control. The results are expressed as a percentage of the value derived for the control group. Values are presented as means ± SEM ((A–C): n = 6, (D–F): n = 3) and statistical analysis was performed using the Welch ANOVA test with the Games–Howell multiple comparison test ((A–C)) and the Kruskal–Wallis test with Dunn’s multiple comparison test ((D–F)). Statistical significance is indicated as follows: * p < 0.05, *** p < 0.001, and **** p < 0.0001 compared to the control group.

