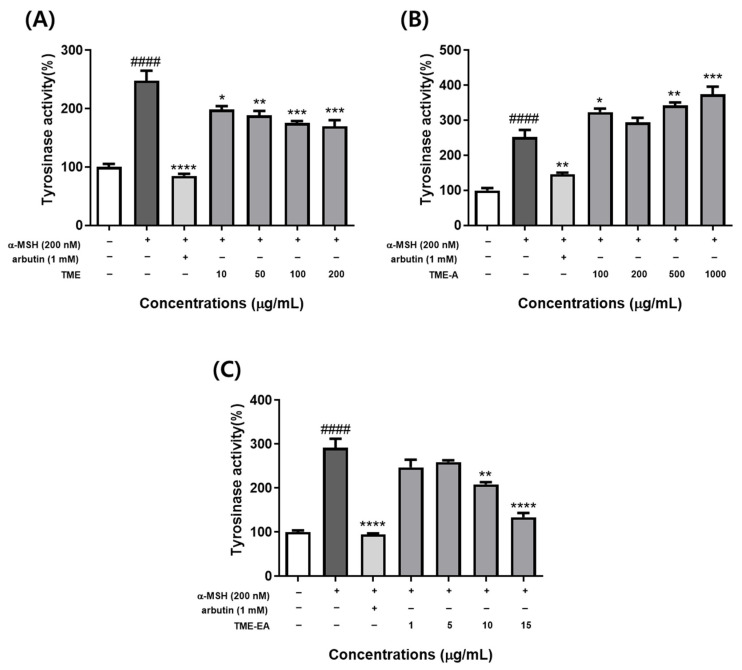
Figure 3.
Effect of TME, TME-A, and TME-EA on intracellular tyrosinase activity. Cells (1.0 × 10⁴ cells/mL) were pre-incubated for 24 h and treated with TME (A), TME-A (B), TME-EA (C), or 200 nM α-MSH for 72 h, and intracellular tyrosinase activity was measured. Values are expressed as means ± SEM (n = 3) and statistical analysis was performed using one-way ANOVA with Tukey’s multiple comparison test. #### p < 0.0001 versus control group, * p < 0.05, ** p < 0.01, *** p < 0.001, and **** p < 0.0001 versus α-MSH treatment group.

