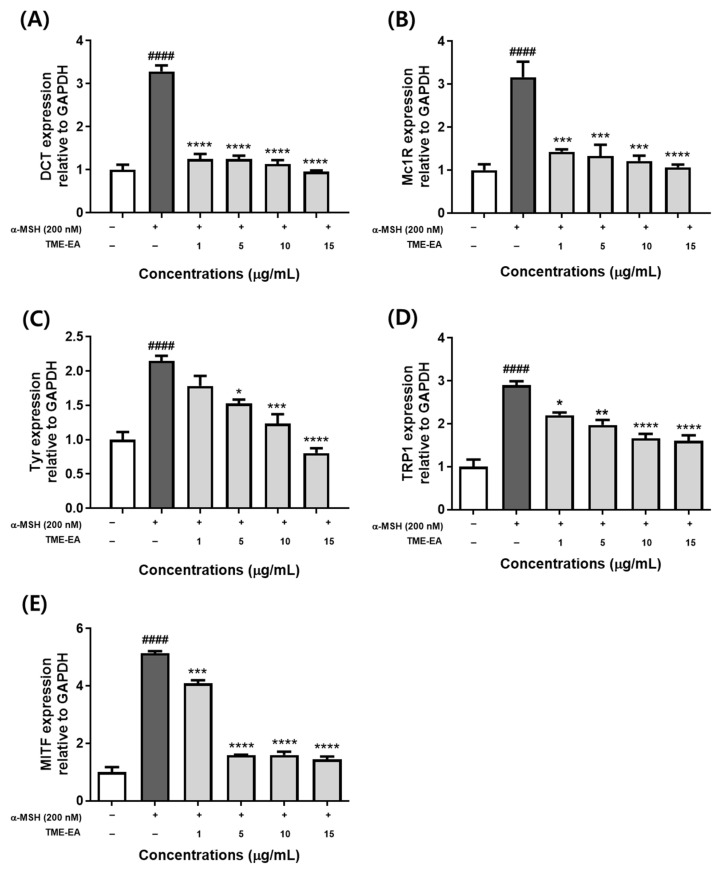
Figure 4.
Effect of TME-EA on genes related to melanogenesis. B16F10 cells were treated with TME-EA (1, 5, 10, and 15 µg/mL) and α-MSH (200 nM). mRNA levels of Tyr (A), Dct (B), Trp1 (C), Mc1r (D), and Mitf (E) were determined using RT-qPCR. GAPDH was used as a reference gene. Data represent means ± SEM (n = 3) and statistical analysis was performed using one-way ANOVA with Tukey’s multiple comparison test. #### p < 0.0001 versus control group, * p < 0.05, ** p < 0.01, *** p < 0.001, and **** p < 0.0001 versus α-MSH treatment group.

