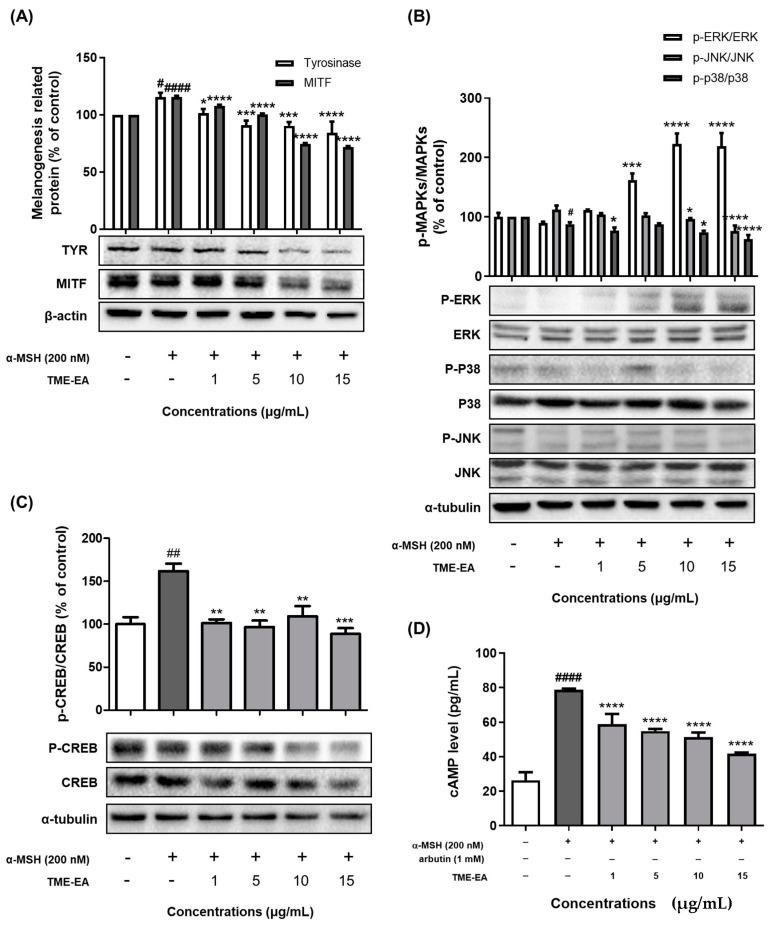
Figure 5.
Effect of TME-EA on melanogenesis-related signaling pathways. B16F10 cells were treated with TME-EA (1, 5, 10, and 15 µg/mL) in the presence of α-MSH (200 nM) for 24 h. MITF and tyrosinase levels (A), MAPK protein phosphorylation (B), CREB phosphorylation (C), and cAMP levels (D) were assessed. Values are presented as means ± SEM (n = 3) and statistical analysis was performed using one-way ANOVA with Tukey’s multiple comparison test. # p < 0.05, ## p < 0.01, #### p < 0.0001 versus control group, * p < 0.05, ** p < 0.01, *** p < 0.001, and **** p < 0.0001 versus α-MSH treatment group.

