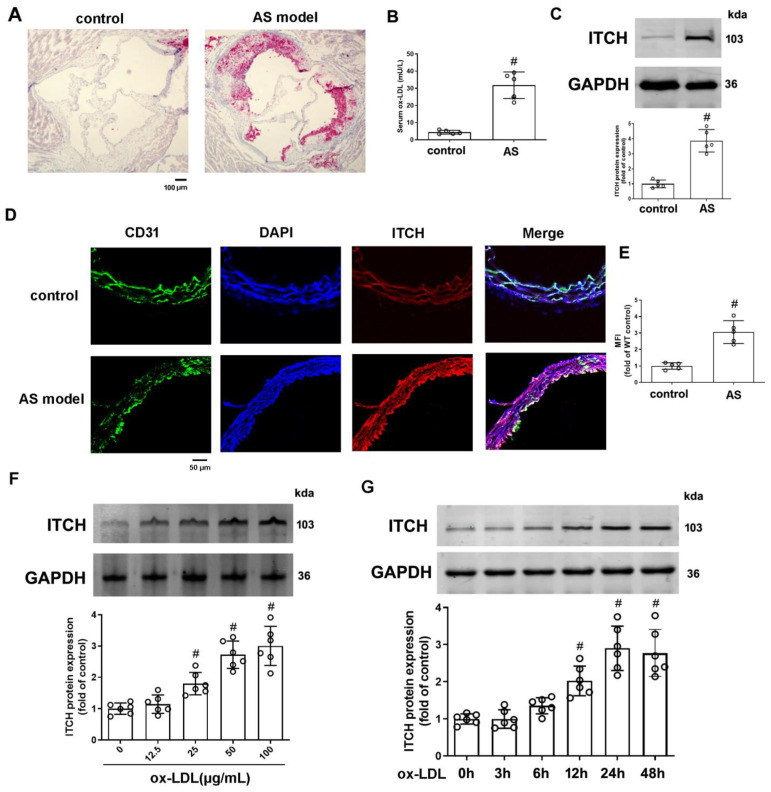
Figure 1.
Expression of ITCH in HFD-fed LDLr−/− mice and ox-LDL-treated endothelial cells. (A) Representative images of aortic root sections stained with Oil Red O. (B) Serum ox-LDL level. (C) Protein expression of ITCH in aorta. (D) Representative images of thoracic aorta cross sections stained with anti-ITCH antibody and CD31, respectively. (E) Quantification of fluorescence intensity of ITCH staining. For (B,C,E), n = 5 distinct samples for each group. (F) Protein expression of ITCH in HAECs that were incubated with various concentrations of ox-LDL for 24 h. (G) Protein expression of ITCH in HAECs that were incubated with 100 μg/mL ox-LDL at various times. For (F,G), n = 6 independent experiments. Results are presented as the mean ± SD. # p < 0.05 vs. control group.

