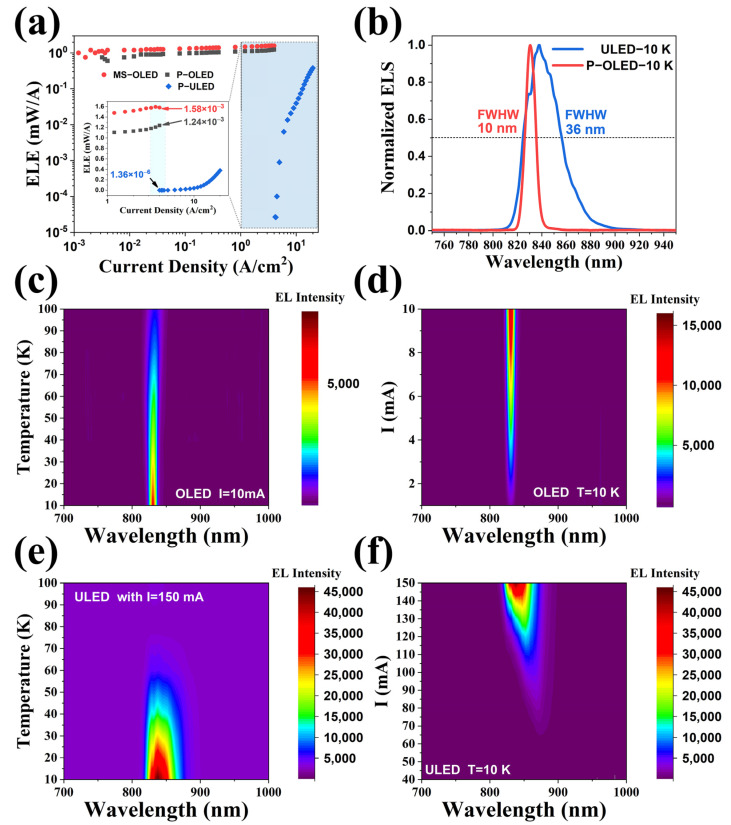
Figure 4.
(a) The ELE of the three LED devices (MS-OLED, P-OLED&P-ULED), in which the dotted lines show the zoom area. (b) Emission spectra of the two devices (P-OLED&P-ULED). (c) Emission spectra of the P-OLED at different temperatures with an injection current of 10 mA. (d) Emission spectra of the P-OLED with different injection currents at 10 K. (e) Emission spectra of the ULED at different temperatures with an injection current of 150 mA. (f) Emission spectra of the ULED with different injection currents at 10 K.

