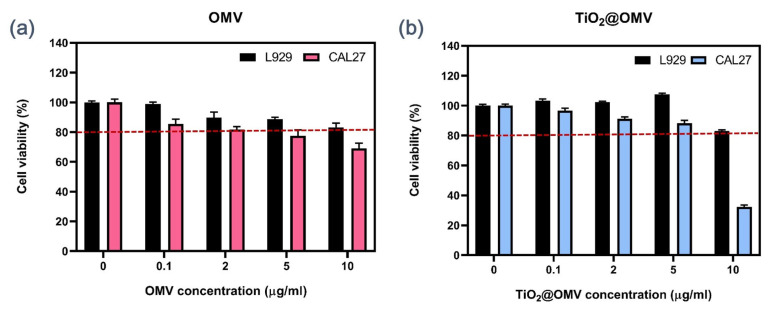
Figure 3.
(a) Cell viability using PrestoBlue Cell Viability Reagent for CAL27 and L929 cells exposed to OMV at different concentrations (0, 0.1, 2, 5, 10 μg/mL) at 24 h. (b) Cell viability using PrestoBlue Cell Viability Reagent for CAL27 and L929 cells exposed to TiO2@OMV nanoparticles at different concentrations (0, 0.1, 2, 5,10 μg/mL) at 24 h. The results are expressed as mean ± standard deviation (SD) of n = 3 biologically independent samples. Statistical analysis was performed using two-way ANOVA.

