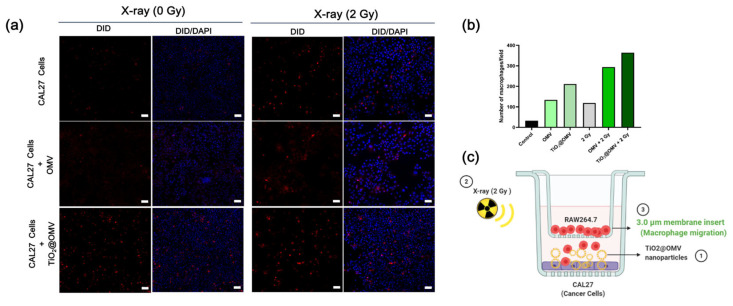
Figure 8.
(a) Macrophage migration was analyzed 24 h after counterstaining cells in the lower chamber with DAPI. Representative images were taken by a Leica fluorescence microscope at a magnification of 20× (Scale bar = 50 μm). (b) The statistics of red fluorescent macrophages seeded to bottom chambers. (c) The presentation of the macrophage–cancer cell co-culture set up in transwell plates (the 3 μm microporous membrane allows for the migration of macrophages). DiD-labeled macrophages were seeded onto the insert and CAL27 cancer cells were seeded onto the bottom chamber. Cancer cells treated with OMVs (5 ug/mL) and TiO2@OMV (5 ug/mL) for 12 h and were subjected to X-ray irradiation (6 MV, 2 Gy) or no irradiation.

