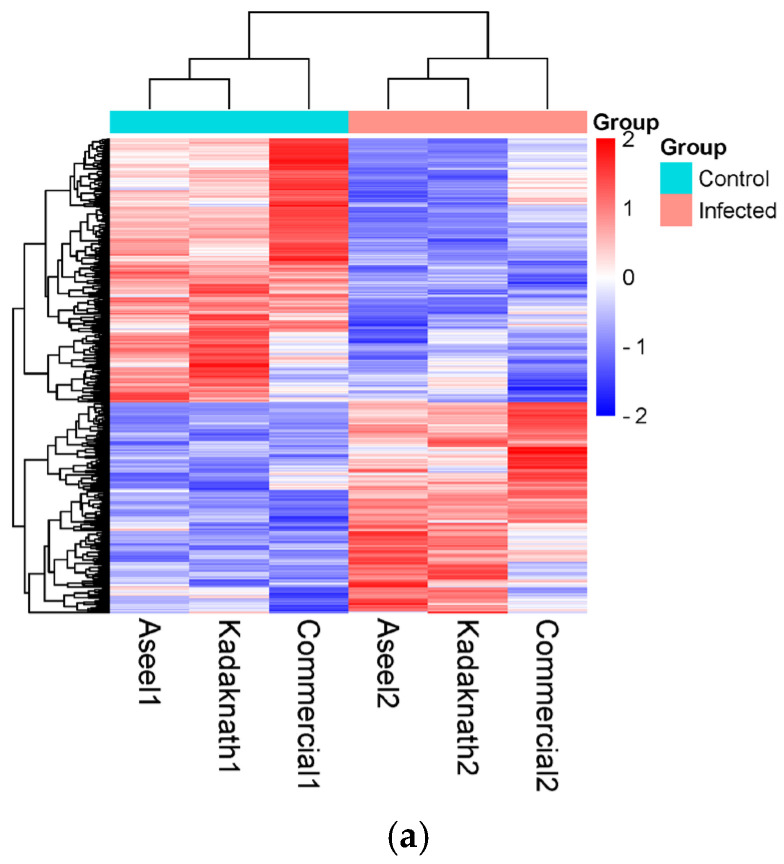
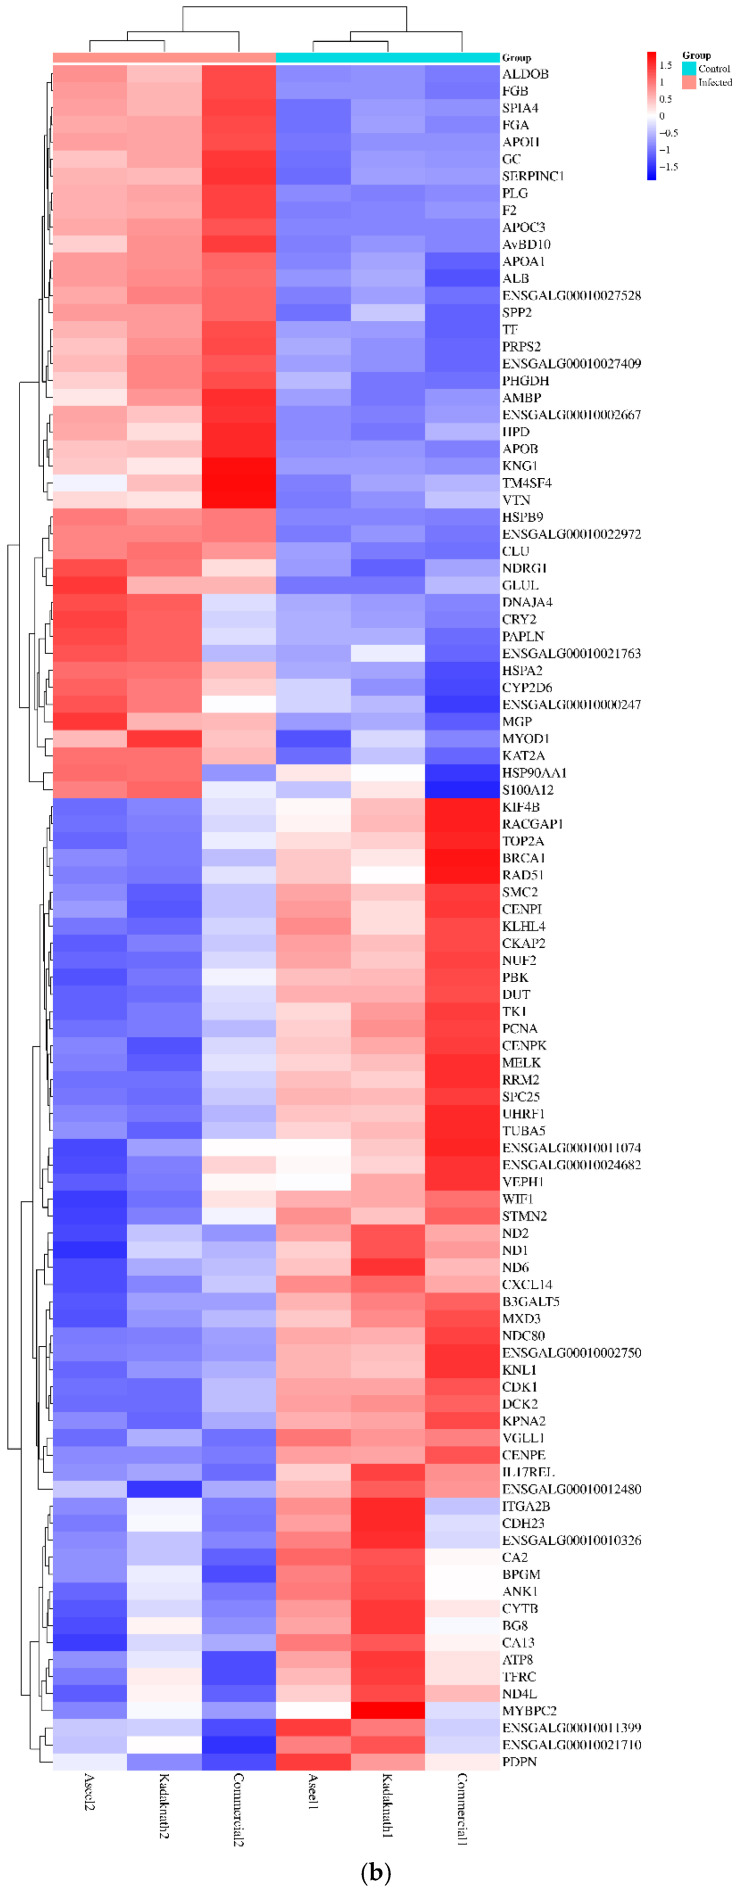
Figure 4.
Hierarchical cluster and expression profile of (a) 594 differently expressed genes (p < 0.002) and (b) the highly significant (p < 10 −7) differentially expressed top 100 genes across the samples. The heat maps were generated from the normalized expression values of each sample for a given gene.


