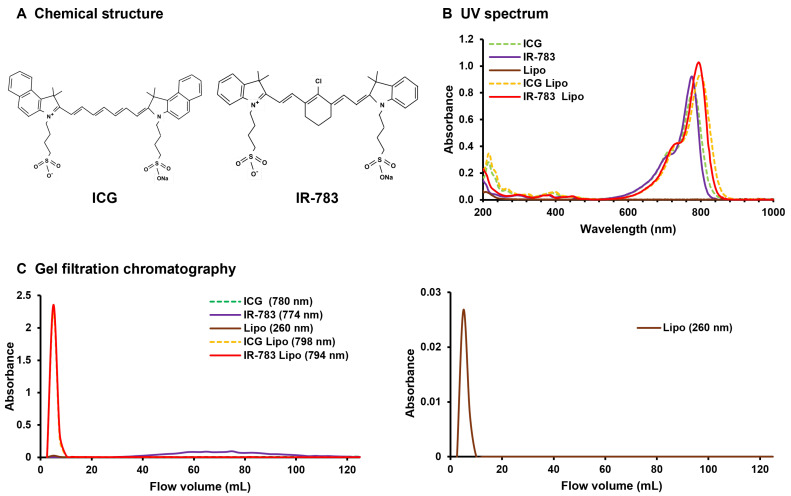
Figure 1.
(A) Chemical structure of ICG and IR-783. (B) UV spectrum results. The light-grey dotted line depicts ICG in isolation, whereas the straight line represents IR-783. The dark grey straight line represents liposomes alone, the black dotted line represents ICG liposomes, and the straight line represents IR-783 liposomes. The absorbance peaks of both ICG and IR-783 tend to shift to the right when liposomes are used. (C) Gel filtration chromatography results. The light-grey dotted line depicts ICG in isolation, whereas the straight line represents IR-783. The dark-grey line represents liposomes alone, the black dotted line represents ICG liposomes, and the straight line represents IR-783 liposomes. The left side shows all liposome types, whereas the right side shows single liposomes with low absorbance values. ICG could not be quantified at the limit of detection, and IR-783 was only sporadically detected in the latter half of the sample owing to its small size. Both liposomized ICG and IR-783 are observed at the same locations as the standalone liposomes rather than at the sites where they are detected independently. This finding confirms that ICG and IR-783 are liposomized. ICG: indocyanine green; Lipo: liposomes.

