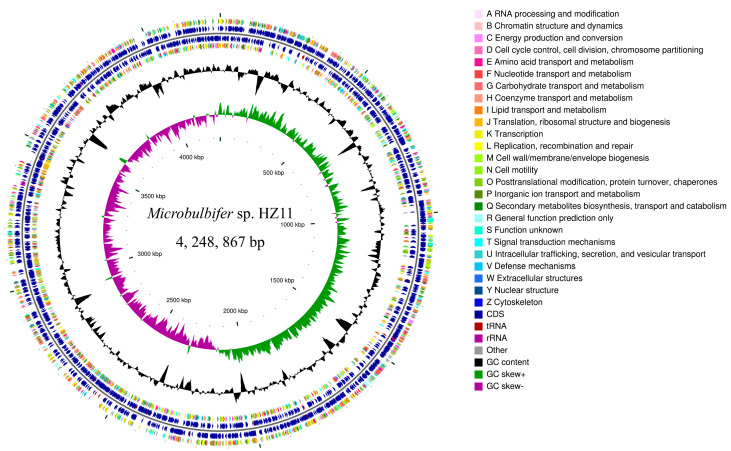
Figure 5.
Circle diagram of the HZ11 genome, from the outside to the inside: the first and fourth circles are CDSs on the positive and negative strands, with different colors representing different COG functional classifications; the second and third circles are CDSs, tRNAs, and rRNAs on the positive and negative strands; the fifth circle represents the GC content; the sixth circle represents the GC-skew value; and the innermost circle represents the size identification of the genome.

