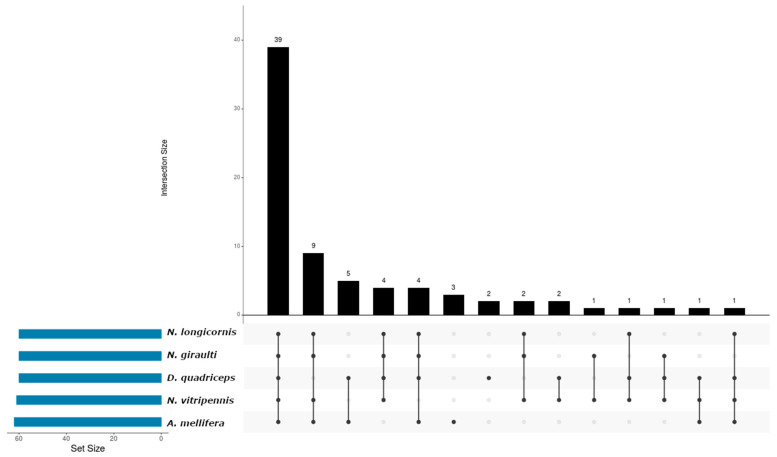
Figure 3.
Interaction graph of de novo miRNAs distributed among the species used in the bioinformatics analysis and that are present in A. calandrae. Each bar on the Y-axis represents the number of conserved miRNAs shared across specific species combinations, as indicated by the dots and connecting lines below the bar. The “Set Size” on the left indicates the total number of conserved miRNAs detected in each species, regardless of overlap. For example, a single dot below a bar represents conserved miRNAs unique to one species, while connected dots represent conserved miRNAs shared among multiple species.

