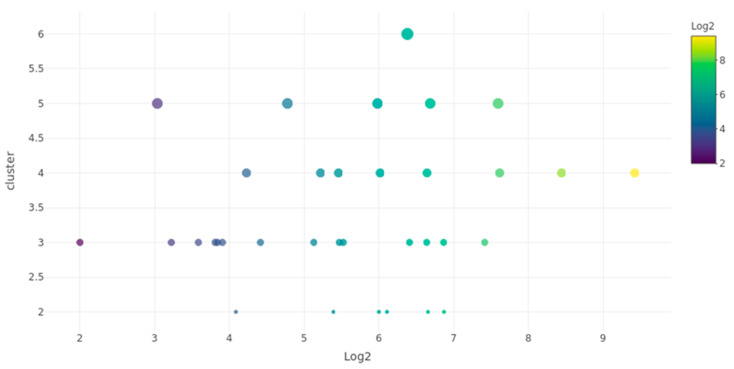
Figure 4.
Expression cluster correlation graph of de novo miRNAs in A. calandrae. The X-axis represents the log2-transformed expression values of de novo miRNAs, while the Y-axis indicates the cluster size (number of reads mapped to each miRNA). The color gradient corresponds to the expression level (log2 values), and the diameter of each point represents the abundance of miRNAs in that cluster.

