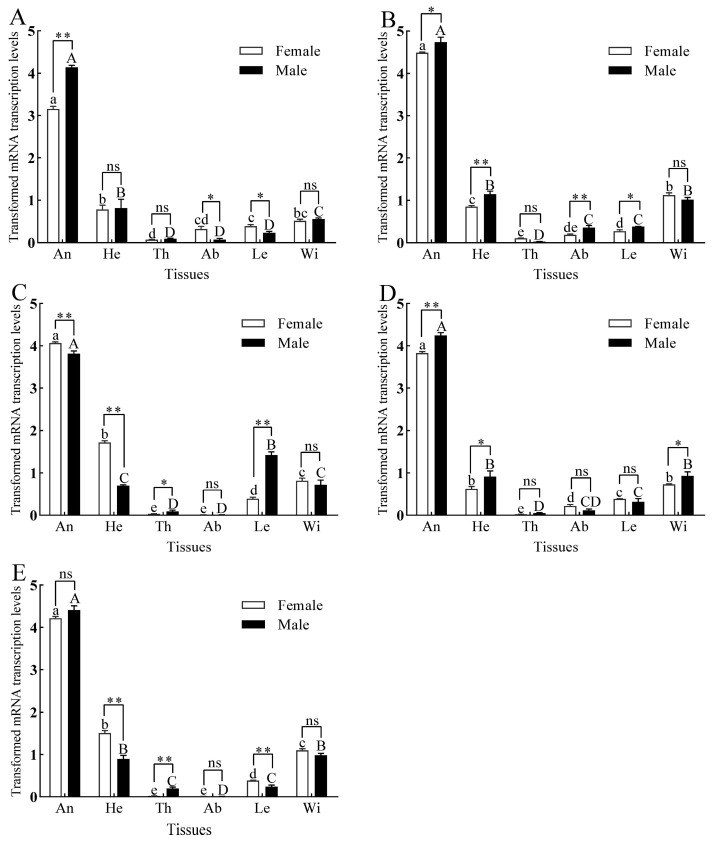
Figure 2.
Tissue expression patterns of three GmolPBPs and two GmolGOBPs. (A) GmolPBP1. (B) GmolPBP2. (C) GmolPBP3. (D) GmolGOBP1. (E) GmolGOBP2. Different lowercase and capital letters above each bar indicate significant differences in relative transcript levels of male and female adults across various tissues, as determined by one-way ANOVA followed by Tukey’s HSD test (p < 0.05). Double asterisks, single asterisks, and “ns” indicated extremely significant differences (p < 0.01), significant differences (p < 0.05), and no significant difference (p > 0.05), respectively, in expression levels between males and females within the same tissue (independent sample t-test).

