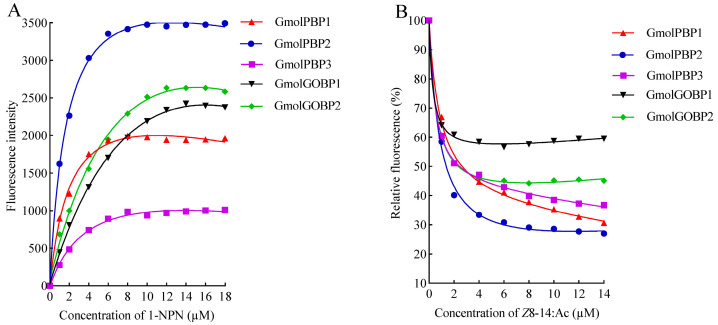
Figure 3.
Curves of rGmolPBPs and rGmolGOBPs binding to 1−NPN probe (A) and sex pheromone Z8-14:Ac (B). In (A), each rGmolPBP and rGmolGOBP protein was diluted to a concentration of 2 µM with 20 mM Tris-HCl buffer (pH 7.4), and then aliquots of 1−NPN were added to reach a final concentration of 1 to 18 µM. The calculated Kd values of rGmolPBP1, rGmolPBP2, rGmolPBP3, rGfunGOBP1, and rGmolGOBP2 were 1.29 ± 0.02, 1.09 ± 0.02, 11.24 ± 0.08, 5.76 ± 0.01, and 4.32 ± 0.02 µM, respectively. In (B), the fluorescence intensity after Z8-14:Ac displaced the 1−NPN probe bound to rGmolPBPs and rGmolGOBPs is displayed as a percentage of the initial fluorescence intensity. The calculated Ki values of the rGmolPBPs and rGmolGOBPs with Z8-14:Ac are listed in Table 4.

