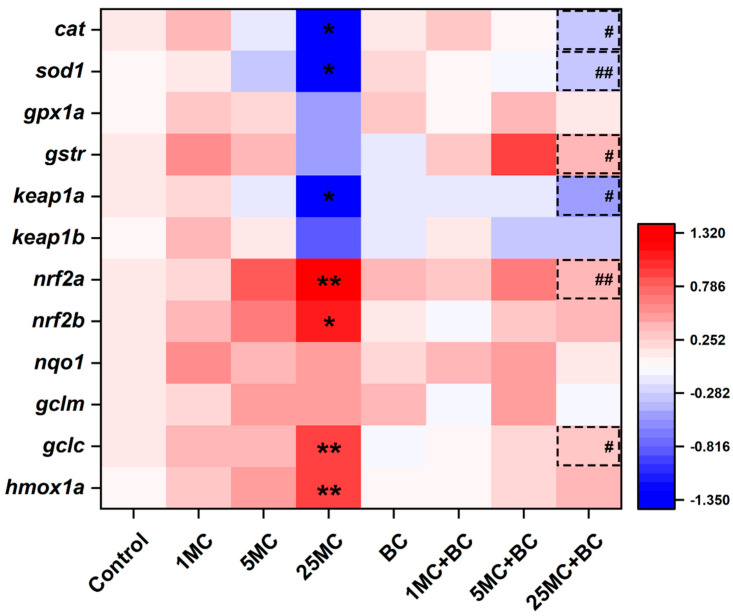
Figure 5.
Heatmap of Nrf2 signaling pathway gene expression. Asterisks (* p < 0.05; ** p < 0.01) indicate significant differences between the treatments and control. The dotted box with hashes (# p < 0.05; ## p < 0.01) indicate significant differences between the MC-LR + BC groups and the MC-LR-only groups, respectively. The values are presented as mean ± SD (n = 6).

