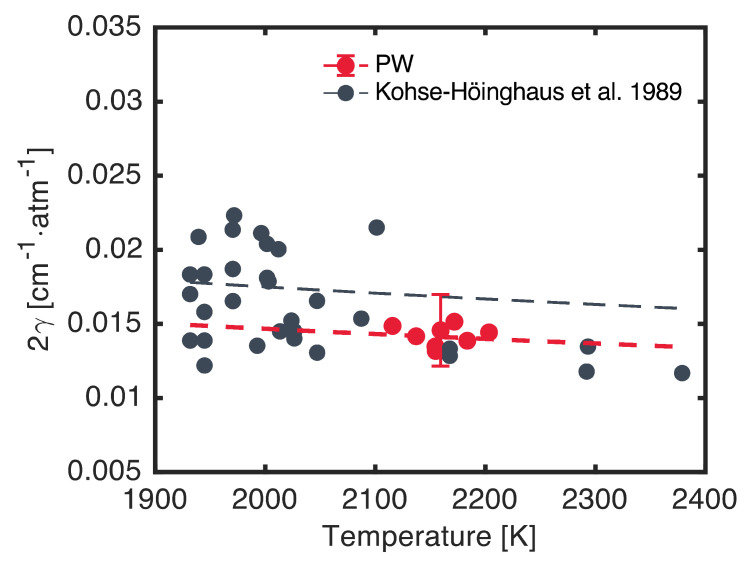
Figure 10.
Measured argon broadening coefficient as a function of temperature for the target transitions (red) in comparison to literature data from Kohse-Höinghaus et al. [6] (black). Power-law correlations are shown as dashed lines. Error bars are uncertainties.

