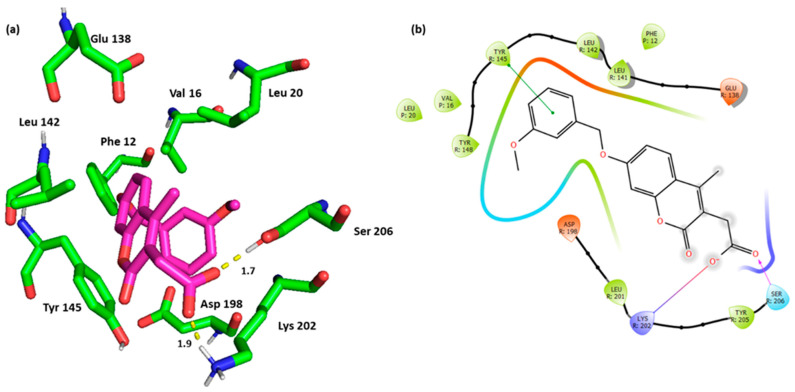
Figure 6.
(a) Three-dimensional representation of the binding interactions between hit 12 and GLP-1 receptor allosteric site and GLP-1 peptide (PDB ID: 6VCB). Ligand atoms are shown as sticks (carbon atoms colored in magenta) and the key residues are shown as sticks (carbon atoms colored in green). Potential electrostatic interactions are represented as yellow dotted lines and are measured in Angstrom. (b) Two-dimensional ligand–protein binding interactions between hit 12 and GLP-1 receptor allosteric site and GLP-1 peptide (PDB ID: 6VCB). H bond is represented as a purple arrow, salt bridge as a blue line, and π-π stacking as a green line.

