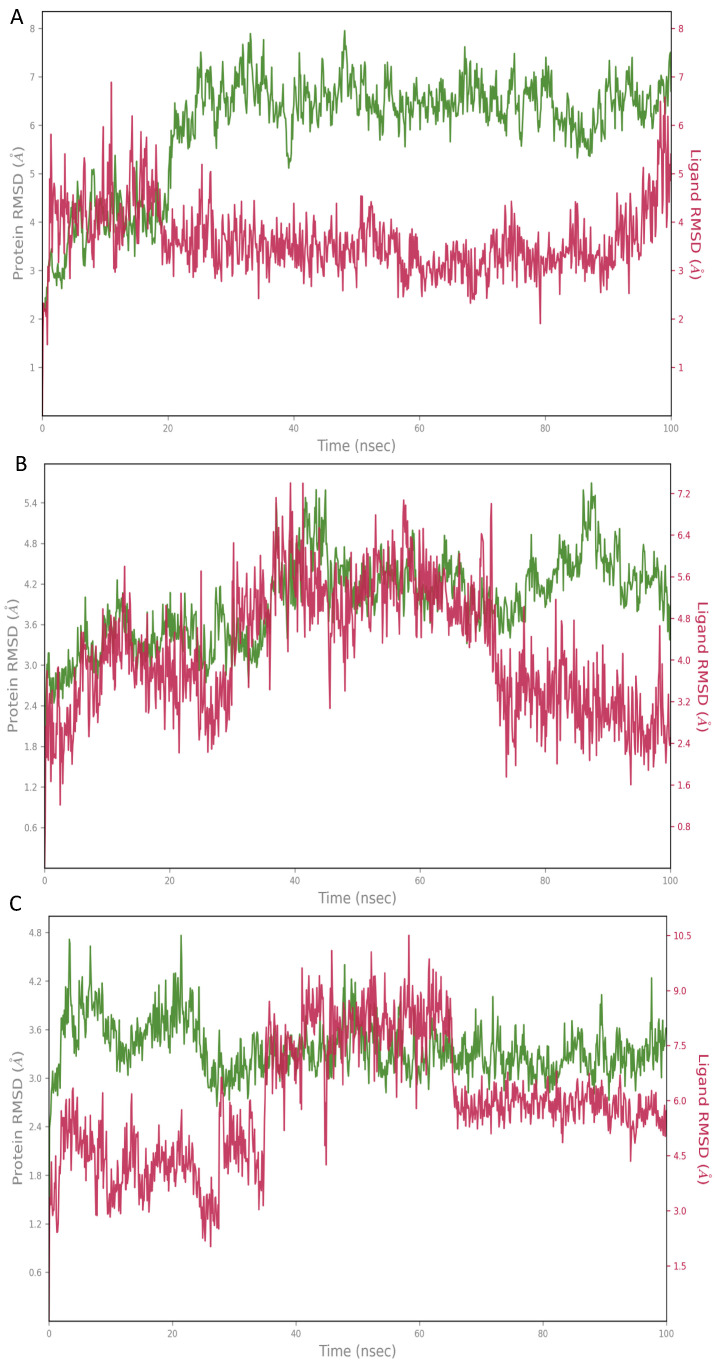
Figure 8.
Root mean square deviation (RMSD) graphs for the hit compounds (A): compound 3 (CNP0086660.2), (B): compound 5 (CNP0039190.2), (C): compound 2 (CNP0549010.1). The green graph shows fluctuations in the protein backbone from the initial reference point while the red shows the ligand fluctuations. The RMSD profile of the ligand with respect to its initial fit to the protein binding pocket indicates that all ligands did not fluctuate beyond a 2–7 Å range.

