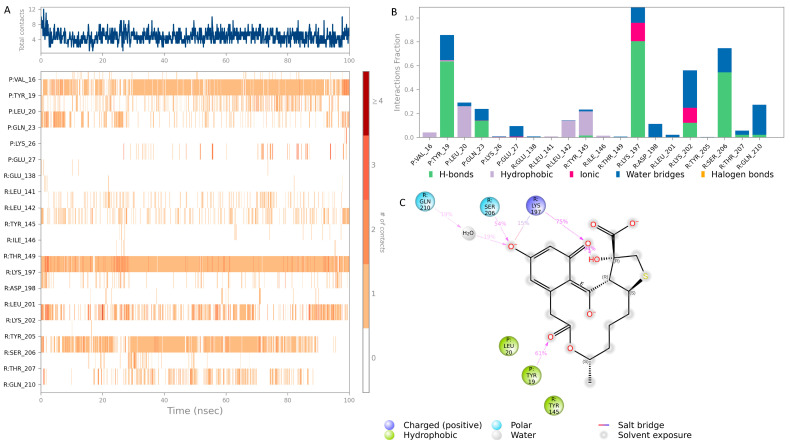
Figure 9.
Interaction diagram of hit compound 3 (CNP0086660.2) with the GLP-1 allosteric binding pocket. (A) Interaction of compound 3 with residues in each trajectory frame. The depth of color indicating the higher the interaction with contact residues; (B) the protein–ligand contacts showing the bonding interactions fraction and the nature of the interactions; (C) graphical 2D illustration of compound 3 interacting with the protein residues during MD simulation.

