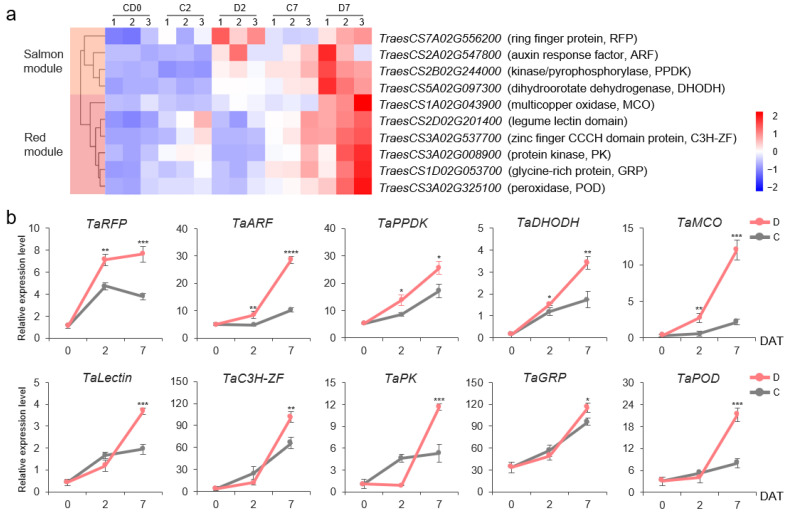
Figure 5.
Response of candidate genes to drought stress in the roots of wheat cv. YH1818. (a) Cluster diagram of the transcription data of 10 DEGs after PEG treatment. FPKM values were normalized by z-score to present different degrees of upregulation, with small upregulation changes appearing in blue and large upregulation changes appearing in red. (b) RT–qPCR results of 10 DEGs after drought stress. D: drought treatment; C: control. The bars indicate the standard error. * indicates p < 0.05, ** indicates p < 0.01, *** indicates p < 0.001, and **** indicates p < 0.0001 according to the t test.

