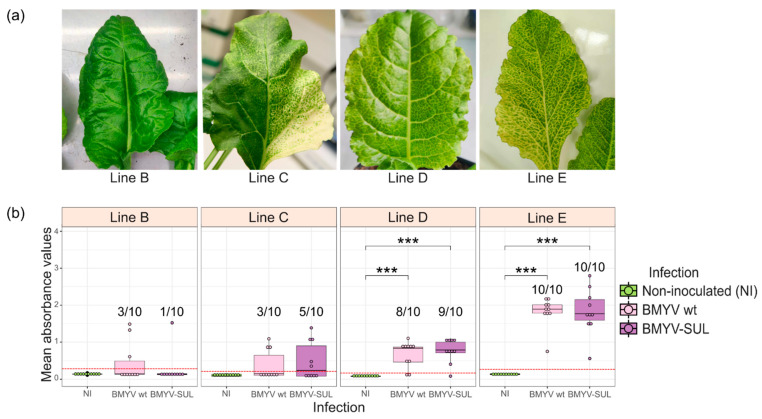
Figure 2.
BMYV-based VIGS experiment in four different sugar beet lines (B–E). (a) Variation in intensities of silencing phenotypes observed in each line. (b) BMYV titer analysed by TAS-ELISA. The absorbance readings are displayed as box plots with non-agroinoculated (NI) plants in green, wild-type BMYV agroinoculated plants in pink and recombinant BMYV-SUL agroinoculated plants in purple. Points above the red dotted line are considered as infected and the infection rates are indicated on the graph. Statistical analyses were performed using a Kruskal–Wallis followed by a Dunn’s test for pairwise comparisons and Bonferroni correction. The stars above the bars indicate the statistically significant differences, p-values less than 0.001 are flagged with (***), and absence of star indicates no statistically significant difference (p > 0.05).

