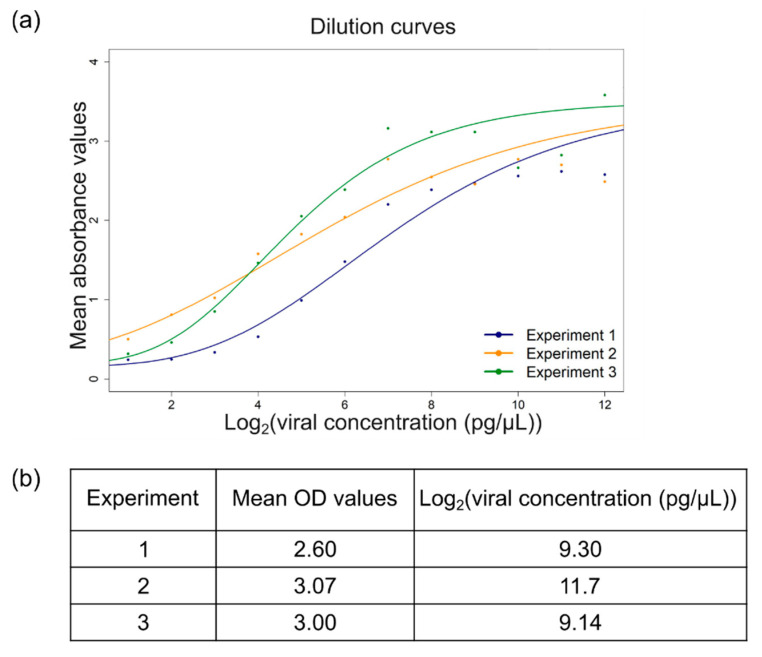
Figure 3.
Statistical modelling of the relationship between ELISA absorbance values and viral concentrations. (a) Three serial dilution curves of purified virus generated in green, orange, and blue, using a five-parameter logistic regression model, following the script provided by Lange et al. [18]. (b) Viral concentrations of the standard sample estimated by interpolating measured absorbance value against their respective calibration curve.

