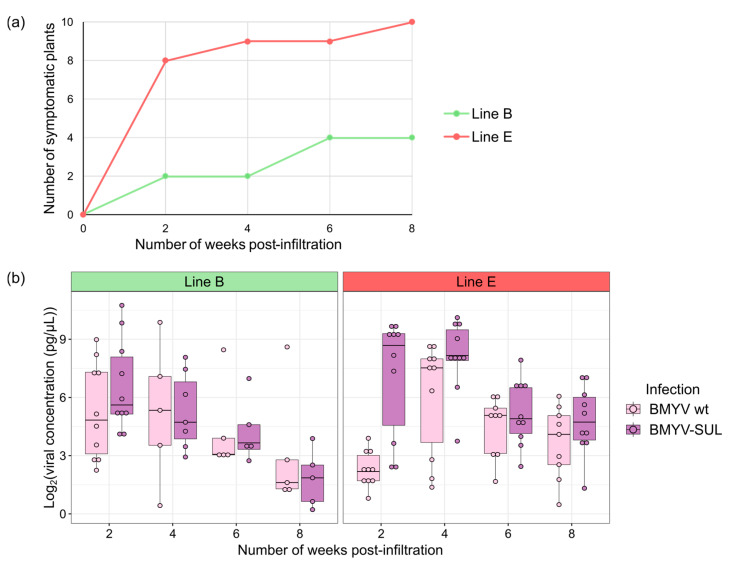
Figure 4.
Time course of BMYV-SUL infection in sugar beet lines B (in green) and E (in red). (a) Visual evaluation of sugar beet symptoms agroinoculated with BMYV-SUL constructs every two weeks, over a period of eight weeks. The number of plants displaying the typical silencing phenotype at each time point is represented. (b) Viral accumulation in plants agroinoculated with the wild-type BMYV or recombinant BMYV-SUL constructs, estimated for each time point by transforming ELISA absorbance, based on the reference dilution curve. The points above the average of transformed values of non-inoculated controls are displayed as boxplots.

