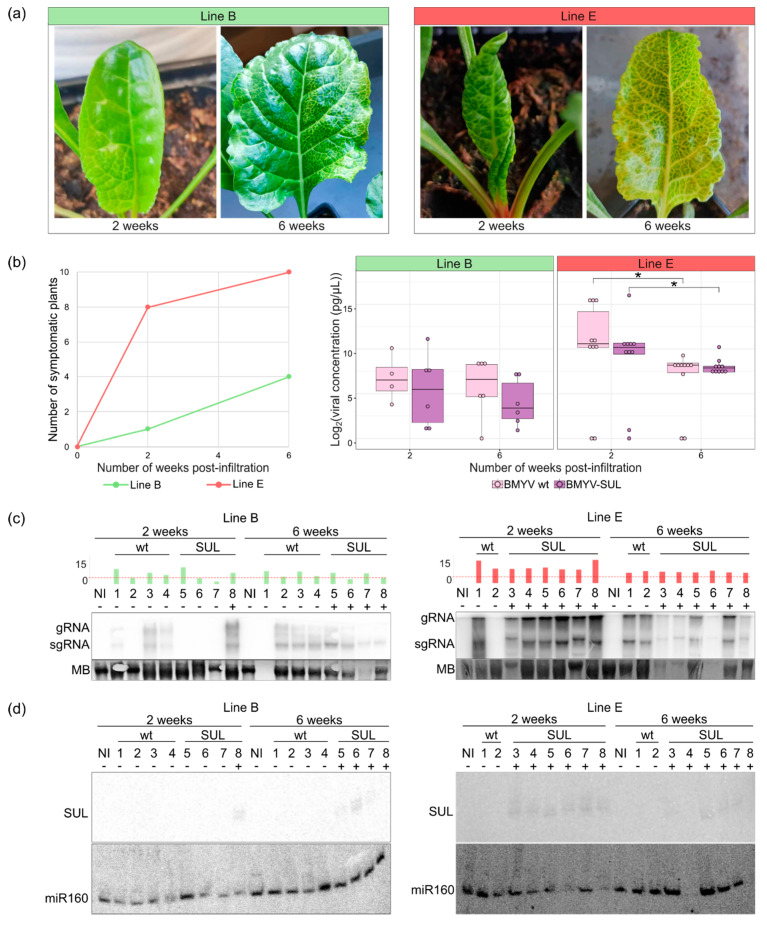
Figure 5.
Comparative analyses of BMYV-SUL infection over time in two sugar beet lines B and E. (a) Symptoms development of sugar beets of the line B (left) and line E (right) challenged with BMYV-SUL at two and six weeks post-infiltration. (b) Number of symptomatic plants of each line, green for plants of line B and red for those of line E (left panel). The boxplot analysis (right panel) shows the dual logarithmic viral load of the plants of each line for the wild-type BMYV (in pink) and recombinant BMYV-SUL (in purple) at two and six weeks. Bars with a star indicate statistically significantly differences (p-value < 0.05), according to the pairwise Kruskal–Wallis and Dunn’s comparisons tests. (c) Northern blot analysis of viral accumulation in non-inoculated (NI), wild-type (wt) or recombinant (SUL) BMYV agroinoculated plants of line B (left) and line E (right). Genomic (gRNA) and subgenomic RNA (sgRNA) of BMYV were detected by using radioactive labelled DNA probe against the P3P5 coding sequence. Methylene blue (MB) staining was used to verify RNA loading. The dual logarithmic viral load of each plant, estimated by TAS-ELISA, is shown above the northern blots as green bars for line B and red for line E, and a red line is drawn at Log2(viral concentration) equals to 4 pg/µL. Asymptomatic and symptomatic plants are respectively annotated by a minus (−) or a plus (+) sign. (d) siRNA detection by northern blot at 2 and 6 weeks, using radioactive-labelled DNA probe targeting the SUL sequence. A universal 21-nucleotides miR160 probe was used to verify loading.

