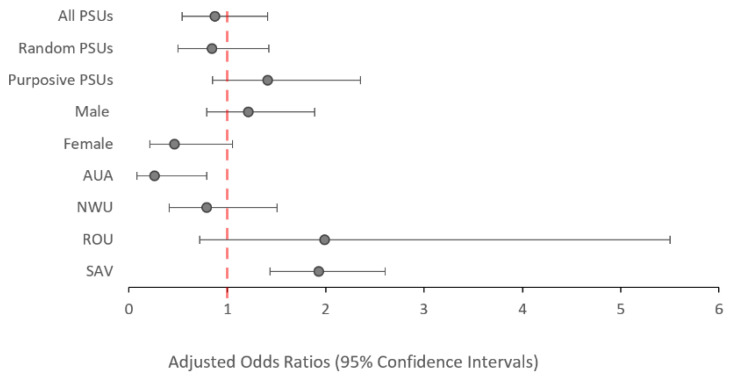
Figure 3.
Adjusted odds ratios of testing positive to antigen in 2019 compared to 2018 (reference value) among all participants aged ≥5 years, stratified by PSU selection, sex, and region. Values above 1.0 indicate and increased odds of testing antigen-positive. Values below 1.0 indicate a reduced odds of testing antigen-positive.

