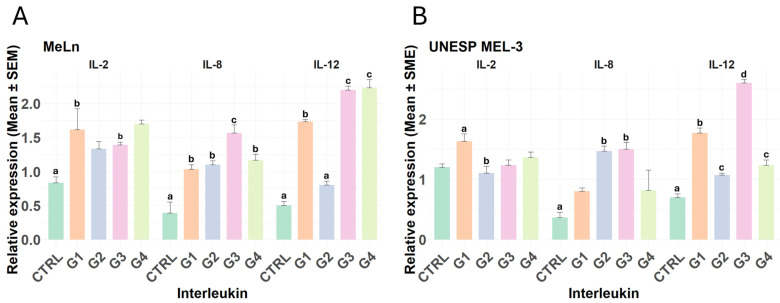
Figure 3.
Relative expression of interleukins 2, 8, and 12. Different lowercase letters indicate statistical differences. (A) In the MeLn cell line, only the groups treated with PBMCs at any point (G1 and G4) showed increased IL-2 expression. CTRL vs. G1; CTRL vs. G4 (p-value < 0.05). Conversely, all groups exhibited increased IL-8 and IL-12 expressions compared to the control (all p-values are in Table S2), with a particularly pronounced increase in IL-8 in G3 and in IL-12 in both G3 and G4. (B) In the UNESP-MEL3 cell line, IL-2 expression remained unchanged across all treatment groups when compared to the control, although G1 showed higher expression compared to G3. IL-8 expression was elevated only in groups treated with Ad-MSCs every 24 h (G2 and G3), while IL-12 expression increased across all groups, with the highest levels observed in groups treated with PBMCs and Ad-MSCs every 24 h (G3).

