Figure 4.
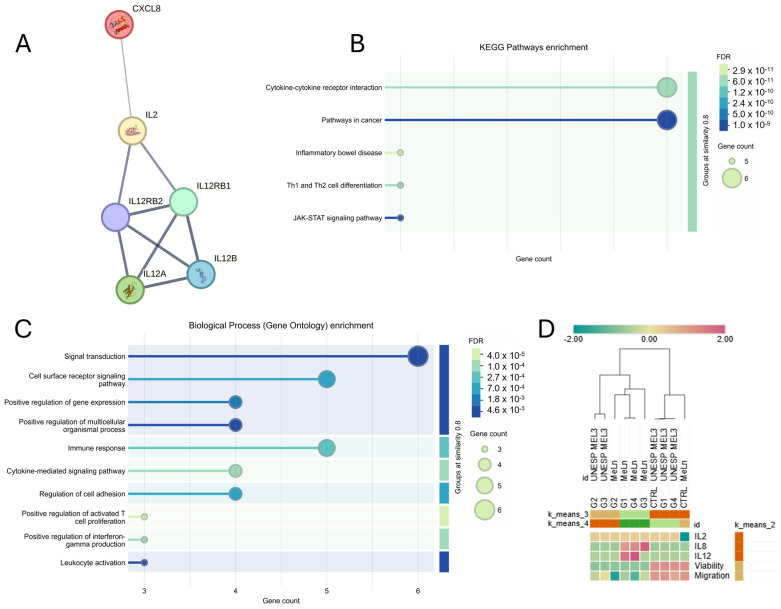
(A) Interactions observed among interleukins IL-2, IL-8, and IL-12 using the STRING tool. The edges represent interactions, with edge thickness indicating the confidence edge of each interaction. (B,C) Pathway enrichment analysis for the studied interleukins using STRING, showing a strong association with cytokine–cytokine receptor interactions, cancer-related pathways, and immune response activation signaling. FDR: False Discovery Rate. (D) Heatmap and clustering of the groups across different cell lines. In the k-means clustering, G2 groups were more closely correlated across cell lines, while G1, G3, and G4 (MeLn) groups were more closely related to each other. Additionally, the control, G1, and G4 (UNESP MEL3) groups clustered together. Hierarchically, MeLn groups were clustered closely together, as were UNESP MEL 3 groups, except for the MeLn control, which clustered closer to the CTRL, G1, and G4 groups of UNESP-MEL3 (Z-score scale).

