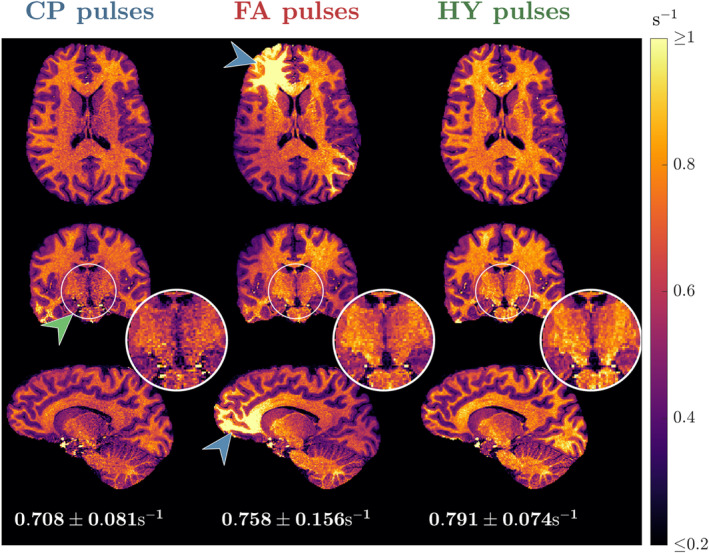
FIGURE 5.

Transverse, coronal and sagittal slices of the maps from subject B using circular polarized (CP) pulses (left column), flip angle (FA) pulses (middle column) and hybrid (HY) pulses (right column). Below each sagittal slice is the average ± SD of in white matter (WM) for the respective pulse type.
