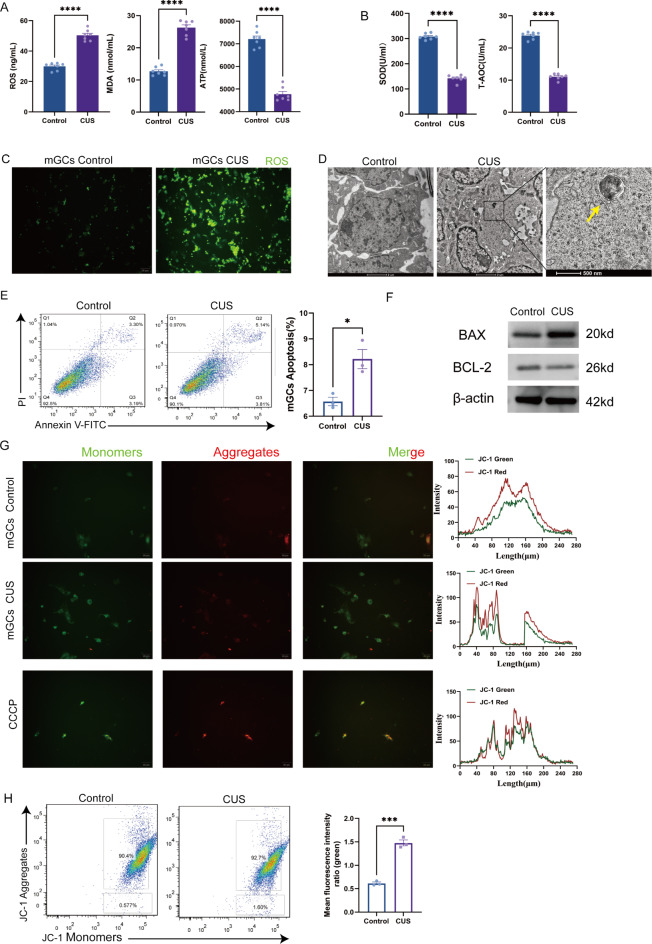
Fig. 4.
CUS promotes mGCs oxidative stress and mitochondrial membrane potential change and triggers apoptosis. (A) Level of ROS, MDA, ATP measured by ELISA in ovary tissues (n = 7). (B) SOD, T-AOC measured by ELISA in ovary tissues (n = 7). (C) ROS fluorescence detection between mGCs from CUS group and Control group. (D) mGCs from CUS group find apoptosis body by TEM. (E) Detection of apoptosis in mGCs by flow cytometry (n = 3). (F) Protein expression analysis of BAX and BCL-2 in the ovaries. (G) JC-1 specifically detected mitochondrial membrane potential excitation at 405 nm fluorescence detection. (H) Mitochondrial membrane potential specifically detected with JC-1 in mGCs by flow cytometry (n = 3). *, P < 0.05; **, P < 0.01; ***, P < 0.001; ****, P < 0.0001.

