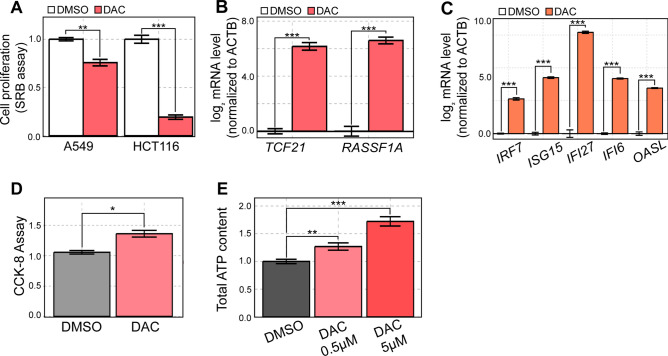
Fig. 1.
DAC is ineffective in A549 cells despite strong induction of TSGs and ISGs. (A) A549 and HCT116 cells were treated with DMSO or 500 nM of DAC and cell proliferation was assessed through the SRB assay four days later. (B) RT-qPCR analysis of the expression of two TSGs (TCF21 and RASSF1A) in cells treated with DAC. (C) RT-qPCR analysis of several ISGs in A549 cells treated with DAC. (D) Cell metabolic activity measured by CCK-8 cell viability assay on an equal number of DMSO and DAC-treated cells. (E) ATP content was measured using Cell Titer Glo in A549 cells treated with either 0.5 μM or 5 μM of DAC. In all RT-qPCR experiments, the quantification of transcript level is relative to the control (ACTB). In all experiments, an average of three biological replicates is shown with error bars denoting s.e.m. A Student’s t-test was performed for statistical analysis. * indicates P-value < 0.05, ** indicates P-value < 0.01, *** indicates P-value < 0.001.

