© The Author(s) 2024
Open Access This article is licensed under a Creative Commons Attribution-NonCommercial-NoDerivatives 4.0 International License, which permits any non-commercial use, sharing, distribution and reproduction in any medium or format, as long as you give appropriate credit to the original author(s) and the source, provide a link to the Creative Commons licence, and indicate if you modified the licensed material. You do not have permission under this licence to share adapted material derived from this article or parts of it. The images or other third party material in this article are included in the article’s Creative Commons licence, unless indicated otherwise in a credit line to the material. If material is not included in the article’s Creative Commons licence and your intended use is not permitted by statutory regulation or exceeds the permitted use, you will need to obtain permission directly from the copyright holder. To view a copy of this licence, visit http://creativecommons.org/licenses/by-nc-nd/4.0/.

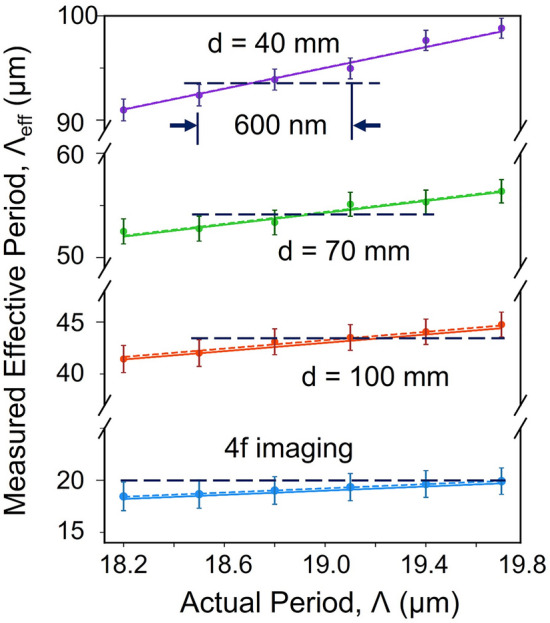
 , as a function of the actual periodicity,
  , of the multi-grating crystal, for different position of the object satisfying 4f imaging condition,
  , 70 mm and 40 mm. The solid lines are the theoretical results derived using the experimental parameters in Eq. 3. The black dash line and black arrows are used to identify the measurement resolution. The error bar is calculated using the measurement error of
  in Eq. 5.