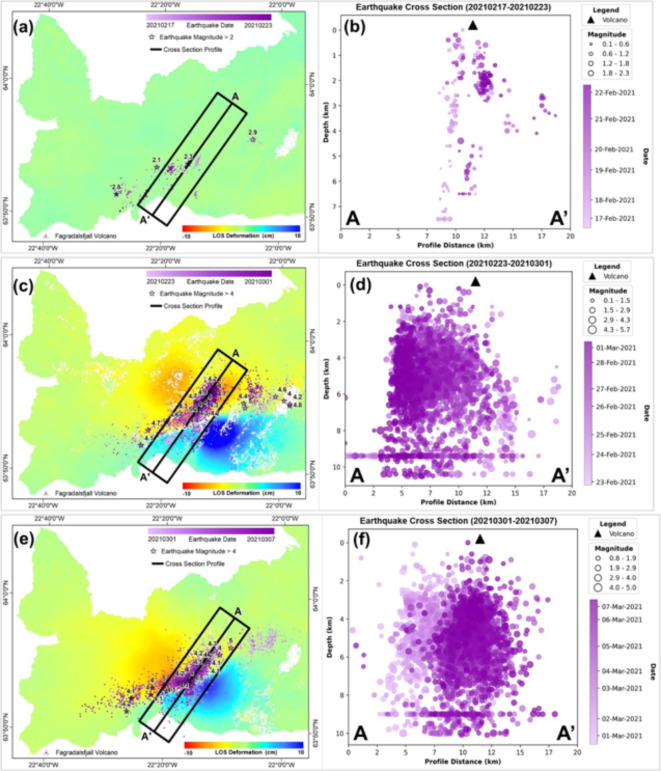
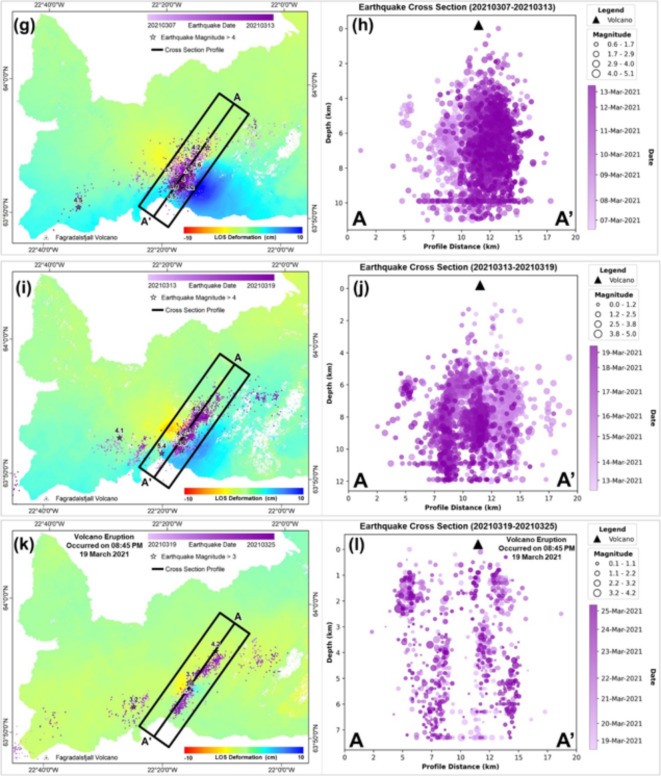
Fig. 7.
The deformation map overlaid by earthquake distribution and cross-section of the earthquake sequences from A to A’: (a, b) 17 February 2021 and 23 February 2021, (c, d) 23 February 2021 and 1 March 2021, (e, f) 1 March 2021 and 7 March 2021, (g, h) 7 March 2021 and 13 March 2021, (i, j) 13 March 2021 and 19 March 2021, (k, l) 19 March 2021 and 25 March 2021. The positive displacement shown by green toward the blue color indicates the displacement toward the satellite, and the negative displacement shown by red toward the green color shows the displacement away from the satellite. The profile cross-section of the earthquake is made 5 km from the middle line profile. The earthquake distribution maps were processed using ArcMap version 10.4 (https://www.esri.com/). Additionally, the scatter plot cross-section of the earthquakes was generated using Matplotlib in Python (https://www.python.org/).


