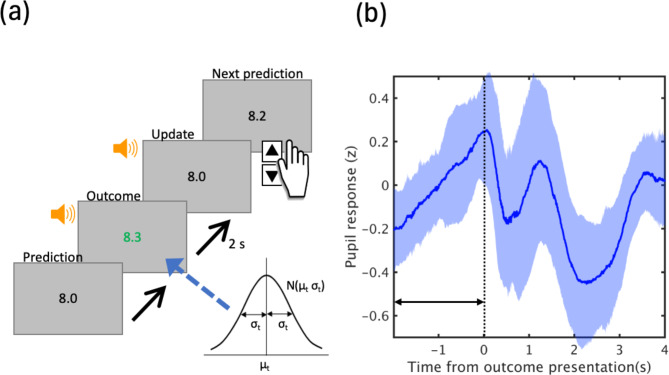
Fig. 1.
Experimental design. (a) For each trial (t) a single integer xt (outcome) sampled from a Gaussian distribution whose mean (μt) changed at non-signaled change points with a hazard rate of 0.1 and fixed SD (σt) of 0.25 in 200 test trials was presented. (b) Time course of grand-averaged pupil dilations (solid line) from 25 participants (200 trials each). A shaded error band represents standard deviation of the mean. Mean pupil diameter was computed for each trial, z-scored by participant, across the 2-s time window before outcome presentation (indicated by an arrow).

