
Figure 3. PTEN facilitates METTL3‐mediated m6A modification.
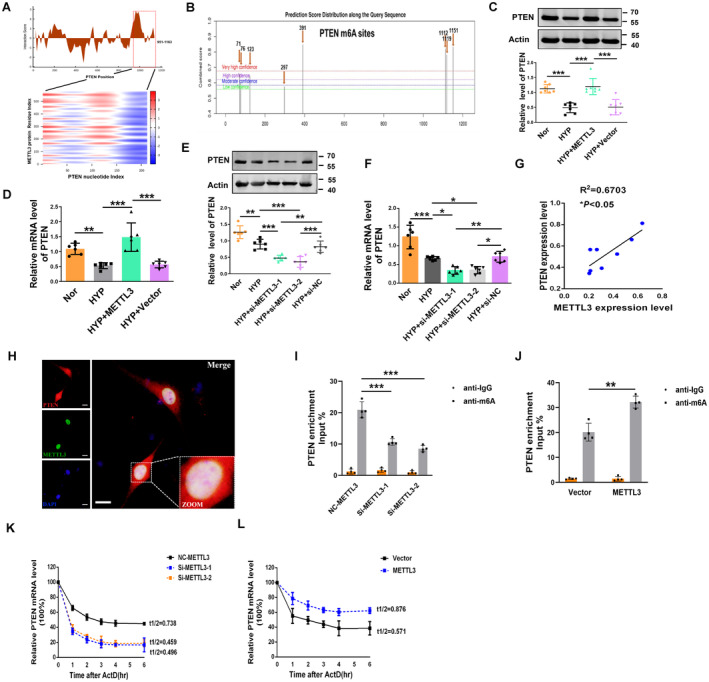
A, CatRAPID analysis prediction of the interaction between METTL3 and PTEN. B, Potential sites and regions of m6A modification in the PTEN gene sequence (http://www.cuilab.cn/sramp). C, D, The protein and mRNA levels of PTEN in METTL3‐overexpressing PASMCs were measured by western blot and qRT‐PCR (Nor, n=6–7; Hyp, n=6–7; HYP+METTL3, n=6–7; HYP+Vector, n=6–7). E, F, Repressive effects of METTL3 siRNA on PTEN expression at both the protein and mRNA levels (Nor, n=6; HYP, n=6; HYP+si‐METTL3‐1, n=6; HYP+si‐METTL3‐2, n=6; HYP+si‐nitrocellulose, n=6). G, The expression of METTL3 was positively correlated with the expression of PTEN in hypoxic mice. H, Colocalization of METTL3 and PTEN mRNA in PASMCs as determined by the confocal immunofluorescence assay. Scale bars=100 μm. I, J, RIP analysis with an anti‐m6A antibody was employed to detect METTL3‐mediated PTEN m6A modifications. The m6A modification on PTEN was enhanced by METTL3 overexpression (Vector, n=4; METTL3, n=4), while it was depleted upon METTL3 knockdown (nitrocellulose‐METTL3, n=4; Si‐METTL3‐1, n=4; Si‐METTL3‐2, n=4). K, L, At the indicated time points, the mRNA levels of PTEN with (Vector, n=4; METTL3, n=4) or without METTL3 (nitrocellulose‐METTL3, n=4; Si‐METTL3‐1, n=4; Si‐METTL3‐2, n=4) depletion in the presence of the transcription inhibitor actinomycin D were measured by qRT‐PCR. Each data point in the figure represents a unique biological replicate. Statistical analysis was performed with one‐way ANOVA. The data are presented as the mean±SD. *P<0.05, **P<0.01, ***P<0.001. ActD indicates actinomycin D; Hyp, hypoxia; m6A, N6‐methyladenosine; METTL, methyltransferase‐like; NC, nitrocellulose; Nor, normal; PASMC, pulmonary artery smooth muscle cell; PTEN, phosphate and tension homology deleted on chromosome 10; qRT‐PCR, quantitative real‐time polymerase chain reaction; RIP, RNA immunoprecipitation; and si‐METTL, small interfering methyltransferase‐like.