
Figure 3. Knockdown of VCAN inhibited EndMT induced by hypoxia in vivo.
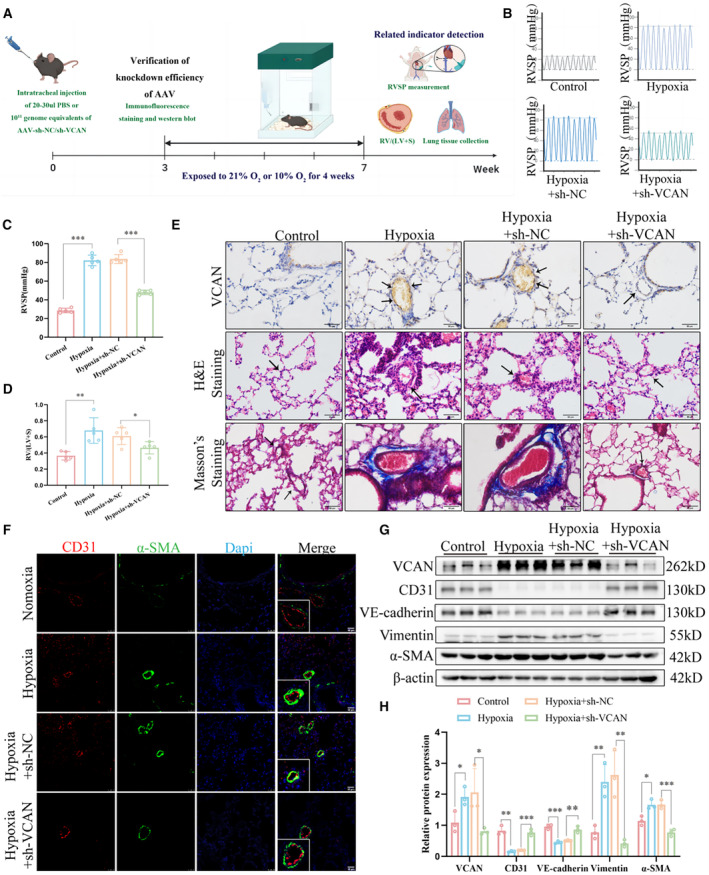
A, The workflow diagram of different intervention groups of mice. (B and C) RVSP was measured using pressure sensors in 4 groups (n=5). ***P<0.001. (D) RV/(LV+S) of heart in mice of 4 groups. *P<0.05, **P<0.05. (E) Immunohistochemical, H&E, and Masson's trichrome staining of representative lung sections from 4 groups (n=5). ×200, scale bar: 50 μm; ×400, scale bar: 50 μm. (F) Co‐expression of CD31 (red) and α‐SMA (green) in the pulmonary vascular endothelium of HPH mice, which was alleviated by VCAN knockdown (n=3). ×400, scale bar: 25 μm. (G and H) The protein levels and densitometric quantification of VCAN, CD31, VE‐cadherin, vimentin, and α‐SMA were determined by Western blot analysis (n=3). *P<0.05, **P<0.01, ***P<0.001. ANOVA with the Tukey test was performed for comparison between 4 groups. AAV indicates adeno‐associated virus; CD31, platelet endothelial cell adhesion molecule‐1; EndMT, endothelial‐to‐mesenchymal transition; H&E, hematoxylin–eosin; HPH, hypoxia‐induced hypertension; PBS, phosphate‐buffered saline; RVSP, right ventricular systolic pressure; VCAN, versican; VE‐cadherin, vascular endothelial cadherin; and α‐SMA, α‐smooth muscle Actin.